Dr. Hoziefa Abbas Alamin Alnaim1
Almaarefa College of Science and Technology- Sudan
Email: hoziefa.abbas@yahoo.com
HNSJ, 2021, 2(10); https://doi.org/10.53796/hnsj21021
Published at 01/10/2021 Accepted at 25/09/2021
Abstract
This study aims to find out the causes of the water outage in the study area, which is the locality of Jubal Awliya, one of the localities of Khartoum state, and then to reach the reasons for this, is it the bad design of the water network in the area and whether it should establish a new network or rehabilitate the existing network.
The population of the region suffers from intermittent water access, which affects human health and the environment, and affects the population growth in the region and the need to study the efficiency of water distribution systems, the high drop-out rate and the increase in agricultural activities in squares, squares and walls of houses that require water.
ARCGIS is one of the strongest systems of drawing and analysis and with comprehensive data capacity of all kinds of areas of life, and with this analytical force, there are some countries of the world that have started to use this program in their daily dealings within the government service institutions and thus affect the future of these institutions on its economy and facilities, since these countries are considered developing countries and Sudan is considered one of them, of the most prominent features of ARCGIS program is its ability to simulate threefold dimensions and create an updated database and Save them on paper and on computers.
Key Words: causes, locality, network, rehabilitate, environment, drop-out, ARCGIS, systems, structures, spatial location.
عنوان البحث
تقييم كفاءة خطوط شبكة المياه بالاعتماد على نظم المعلومات الجغرافية
د. حذيفة عباس الأمين النعيم1
1 كلية المعرفة للعلوم والتكنولوجيا – السودان
بريد إلكتروني: hoziefa.abbas@yahoo.com
HNSJ, 2021, 2(10); https://doi.org/10.53796/hnsj21021
تاريخ النشر: 01/10/2021م تاريخ القبول: 25/09/2021م
المستخلص
يعاني سكان محلية جبل اولياء من وصول المياه بشكل متقطع والتي تؤثر على صحة البشر وتأثر على النمو السكاني في المنطقة ولابد من دراسة كفائتة شبكات توزيع المياه.
يعد برنامج ARCGIS من أقوى أنظمة الرسم والتحليل الخاصة بنظم المعلومات الجغرافية ومع وجود سعة كبيره تحفظ فيهل البيانات الجغرافية لكل أنواع مجالات الحياة و القوة التحليلية التي يتميز بها هذا البرنامج.
هناك بعض دول العالم التي بدأت في استخدام تقنية برنامج ARC GIS في تعاملاتها اليومية داخل المؤسسات الحكومية الخدمية وبالتالي يؤثر على مستقبل هذه المؤسسات على اقتصادها ومنشآتها، وبما ان هذه الدول تعتبر من الدول النامية والسودان يعتبر واحدا منها وهو لم يكمل بنيته التحتية بالكامل. ومن اهم هذه البنيات شبكات مياه الشرب المصحوبة بالموقع المكاني والقوة التحليلية , ومن أبرز مميزات برنامج ARCGIS قدرته على المحاكاة ثلاثية الأبعاد وإنشاء قاعدة بيانات مكانية محدثة وحفظها على الورق وعلى أجهزة الكمبيوتر.
تم تصميم مخططات توضح مراحل التصميم والتحليل وتم تحليل شبكة المياه من خلال برنامج ARC MAP وتطبيق التحليل من حيث اقة خطوط المياه مع طبيعة الأرض وهو ما توفرة نظم المعلومات الجغرافية .
1- Introduction
Water networks should be long lasting and stable Taking into consideration that Jubal Aweliya Locality has areas of water supply we redoing this research aiming to design water network to help the populace with an easy and modern access to water.
The general benefit of GIS applications is that they offer their users an answer to the models of questions, to access solutions that discuss both location and condition conditions and form model, and then take advantage of them to answer the previously identified questions. Use of contour lines analysis that illustrate the heights and low of earth and DEM, analyzing water Line networks using of tool utility network analyst.
2- Location of study Area
Here we mean the astronomical and geographical location and the decline from sea level or Proximity and distance from the equator. Local Jubal Awliya geographical location and borders of the White Nile begins westward the drainage south of Azuzab, heading east to cross the railway Line, heading south, eastward and north to return and continue eastward with the Railway line to the warehouse area.
The local is located between two degrees’ width 15.2608 north and longitude 32.2516 east and Rises from the sea surface height of
382 m.
2-1- Administrative division of Jubal Awliya locality
The local was established by a decree issued by the state government in 2003 and consists of the following administrative units this Jubal Aweliya administrative unit and al Nasr unit and Al-Azhari administrative unit and al klakla administrative unit, following figure (1). (General Administration Area of Khartoum State).
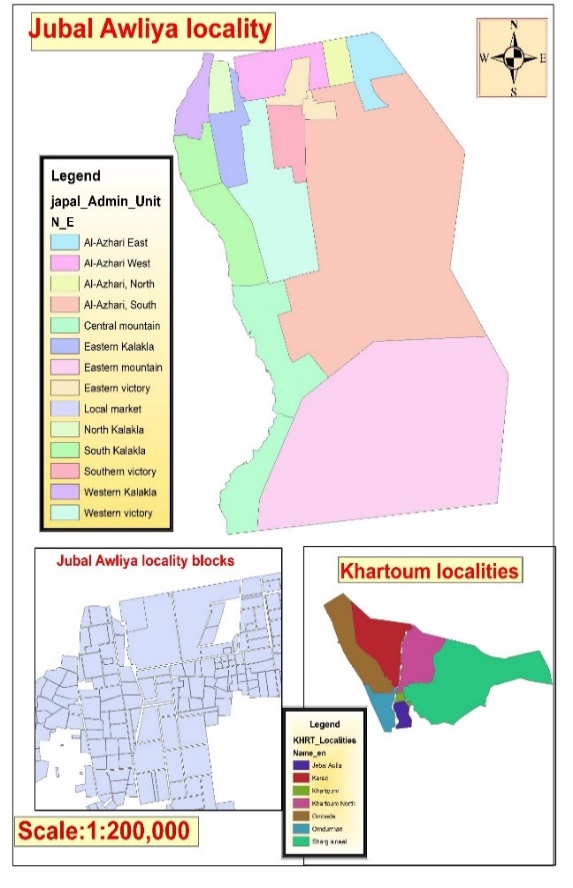
Figure (1): Jubal Awliya locality.
Source (Ministry of urban planning in Khartoum states)
3- Problems of the Research
The Problem is that a few houses are supplied with tap water but water pressure is low in pipes according to studies. There is need to find solutions which can overcome the problems of the region with regard to the water network. It is possible to solve the problem of the networks that do not have constant water supply or reduce it to a minimum through the development.
Of database for the m3anagement of the water distribution network systems using geographical mapping which this study is trying to do in this project.
4- Hypothesis Research
This research is based on a number of assumptions and is represented in the following:
1-Population growth in the area has significant role in the decrease of the water supply Because of the increasing consumption.
2-The lack of material resources has significant impact on the worsening water crisis in the area.
3-The water problems in the area and have negative multiple effect on its development.
4-The geographical location affects the momentum of water in the study area.
5-The inadequate and limited number of machinery and stations has contributed in the Growing Problem of water shortage in the study area.
5- Objectives Research
1- design and management of water distribution networks that are not regularly covered by water the focus has been on such networks.
2- Relationship between water pipelines and surface.
3- This study aims to draw attention to one of the rural areas that can contribute significantly to overall agricultural production if available water resources were stabilized.
6- pipeline
With diminishing water supplies and rapid population growth, communities and countries are being prompted to investigate alternative water resources. With growing population, this number will drastically increase, especially as we continue to abuse, pollute, and deplete our current supplies.
Water pipelines are built and often, in the form of parts connected together by footnotes private connections installed to prevent water leakage, or tighten the valves that prevent the payment of water and gas leaks.
The length of the pipeline could be up to more than 4,800 km. The diameters of pipelines ranging between five centimeters and 5 meters. And buried pipelines under the earth’s surface about meters, while others are thrown on the ground or Placed on the pillars installed on the roof, (Tutorial 1, piping system online).
6-1- Type of pipeline
- Glazed pottery, including pipes and normal.
- Pipe Viper armed fiber glass.
- Metal tubes of steel and cast iron and gray cast a floppy.
- Tubes of regular and reinforced concrete.
- Plastic pipes poly Atheling or polyvinyl chloride or polypropylene.
6-2- Diameters
Water from a quarter inch to 4-inch connections to homes.
And measured polypropylene Tubes with 20 ml of milliseconds and up to 160 mm, the exchange of 150 mm to 700 mm, Regression Complexes and tunnels until 1000 mm 3500 mm Hoses up to 200 mm.
6-3-Valves
mechanical device used to control liquid or gas flow in particular flow system, or to regulate Pressure in certain locations of this system, the valves are graded from valves diameter of several centimeters to the valves of several meters’ diameter, the valves are used in distribution water networks in cities for a variety of purposes.

Figurer (2): Stage design of Project. Source (Author.2021)
7-Pipe Networks Design
The Pipe design module allows users to rapidly select least-cost pipe lay-outs for new Network design or rehabilitation programs the new module applies sophisticated optimization techniques to select the lowest cost design subject to the quality of service constraints, following figure (2).
Users also provide design constraints such as minimum and maximum pressures and Velocities that must be maintained in the resulting design.
Each constraint can be weighted so that some constraints are given greater consideration than others in determining final design, (Dr.Gamma Dawood 2014).
8-Design layers
After obtaining all the required data, the number of layers needed for the study was
Determined, namely, fourteen layers as follows:
8-1-Water network layers
1- Main Pipes layer.
2- Sub-line layer (Secondary Pipes).
3- Control valve layer (get Valve).
4-Source layer.
8-2-Design of metadata tables
After you select the number of layers and the type of each layer, the number and type of Fields for each layer are specified.
8-3-Creating layers
To create a new geo database, the arc catalog is pressed from within the ARCMAP program.
To create a new geo database, follow these steps connect folder was pressed and the project folder was selected, and the geographic database was created by choosing New/File Geo database, and the new feature data set was selected.
The coordinate system was chosen based on the shape file of the ministry of urban planning Khartoum state department of Information systems geography and the preparation of digital maps.
8-4-Digitizing Process
Layers are inserted in the ARC map to avoid errors snapping is activated, and then start the digitization process using the editor, where you choose the layer you want to work on and choose create feature.
Using the sketch tool by clicking on the first point to start digitization, and then drawing the selected parameter, when the drawing finishes, the right mouse button is pressed and the finish sketch is selected, so the rest of the features are continued in the rest of established Layers.
8-5-Create Database
In the program Arc Catalog created as:
8-6-Creating a personal geo database
Involves creating an mdb file on disk this can be done from the Catalog tree in ARCMAP or using create personal GDB geo processing tool.
Create personal GDB geo -Processing tool, you can create geo database that corresponds to an older release of ARCGIS.
This ability allows you to share data with people who have older releases the ARCGIS, since older releases of ARCGIS may not be able to open newer releases of the geo-Database, (Tutorial 2, ESRI ARC GIS web site online).
To create new geo database and personal geo data base in arc catalog is pressed from within the ARCMAP program after that building pipelines and valves following figure (3).

Figure (3): Digitization. Source (Author. 2021)
8-7-Diameter pipelines
Each pipe takes a certain size, the main line is 32 inches and then branches to 24, 12,8 and 6, And in the internal streets takes 4 inches and enters the houses 2 inches and a half inches.
8-8-Material pipelines
A water pipe is any pipe or tube designed to transport treated drinking water to consumers the varieties include large diameter main pipes, which supply entire towns, smaller branch lines that supply street or group of buildings, or small diameter pipes located within individual Buildings. Materials commonly used to construct water pipes include cast iron polyvinyl chloride (PVC), Copper, steel or concrete, following figure (4,5,6)
Water pipe is any pipe or tube designed to transport drinking water to consumers, if the Water is treated before distribution or point of use (POU) depends on the context, (Water Aid .2010).
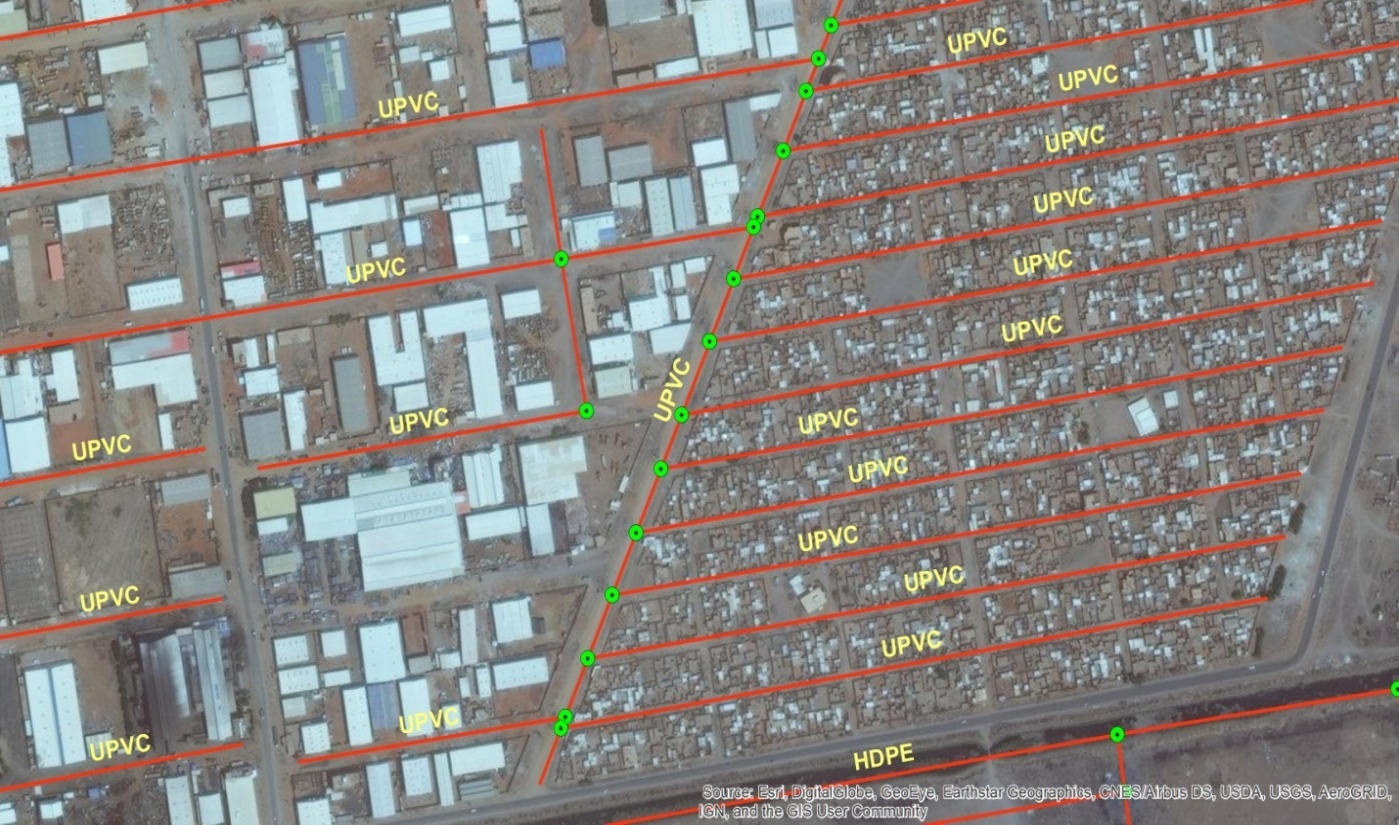
Figure (4): UPVC, HOPE. Source. (Author.2021)
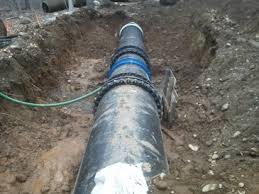
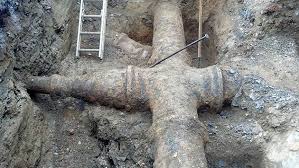
Figure (5): PVC, HOPE. Source (Khartoum State Water Authority).
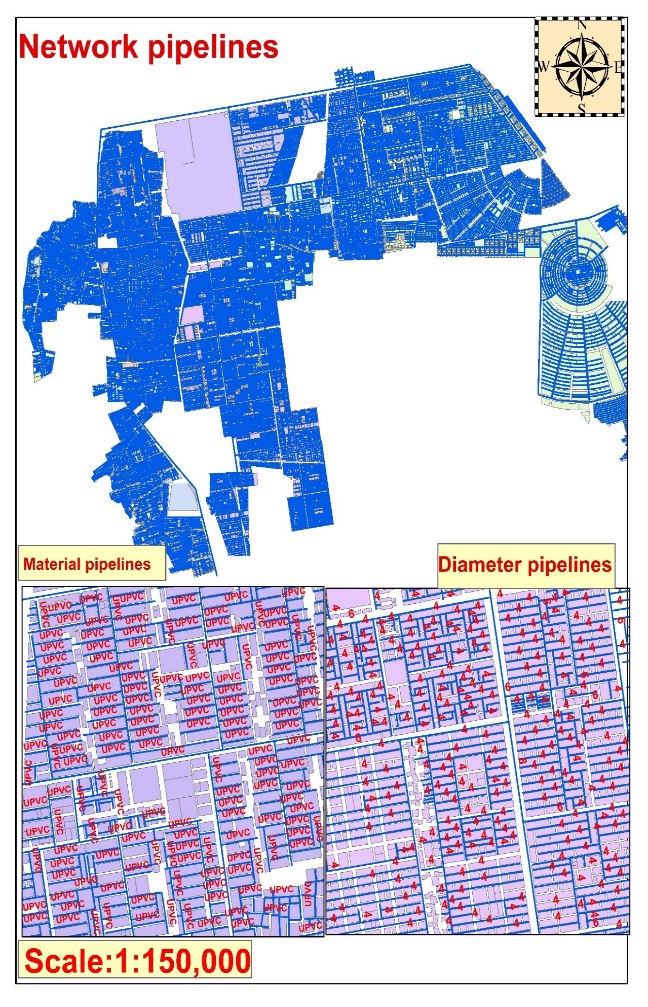 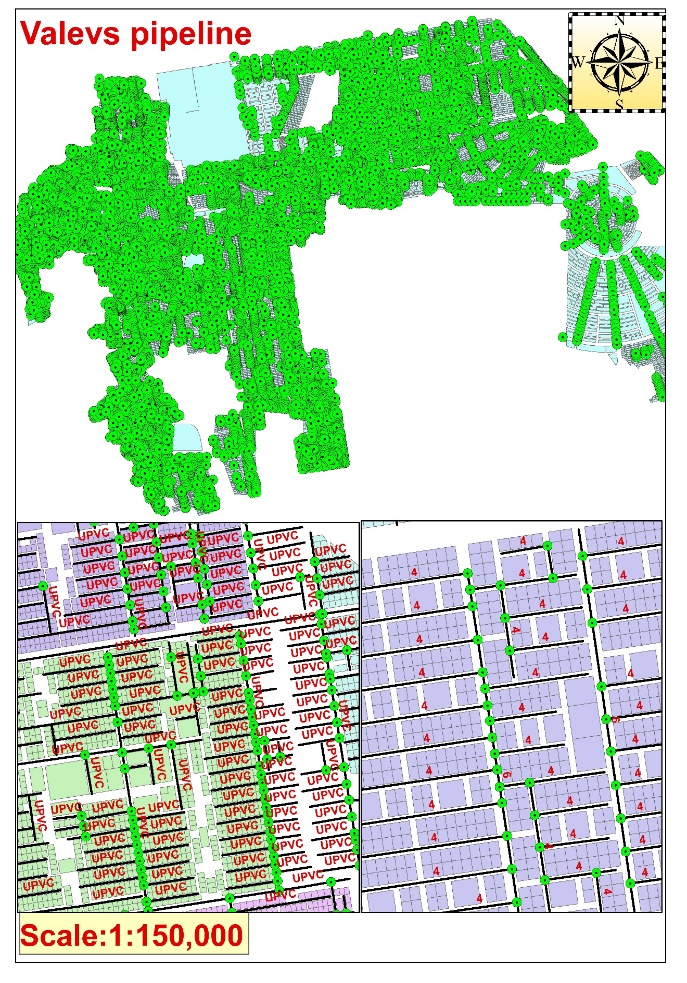
Figure (6): Pipelines maps. Source (Author.2021) |
9-Principle of GIS
A geographic information system (GIS) is a computer system for capturing, storing, checking, and displaying data related to positions on Earth’s surface. By relating seemingly unrelated data, GIS can help individuals and organizations better understand spatial patterns and relationships.
GIS technology is a crucial part of spatial data infrastructure, which the White House defines as “the technology, policies, standards, human resources, and related activities necessary to acquire, process, distribute, use, maintain, and preserve spatial data.
Such a map would help people determine where water supplies are most at risk, (Caitlin Dempsey GIS Learning. 2015)
9-1-Program used
The program is an integrated family of number of GIS programs produced by ESRI (Institute and Environmental Research Systems) of America for the production and analysis of digital Maps.
10-Topographic maps (contour)
maps that illustrate the horizontal drawing of different parts of the levels of the surface of the earth according to specific scale of drawing.
This map shows the general shape of the surface the earth and sites of cities and roads and borders and others, (S. Spinello and G. Pascal.2004).
10-1-Digital elevation model
A digital elevation model (DEM) is a digital model or 3D representation of terrain’s Surface commonly for a planet (including Earth), moon, or asteroid created from terrain elevation data, following figure (7), (P. Arrighi and P. Soille.1999).
10-2-Slope
Surface of which one end or side is higher level than another a rising or falling Surface he Slithered helplessly down the slope (of surface or line) be inclined from horizontal or vertical line, slant up or down, following figure (7).
The garden sloped down to a stream slope is calculated by finding the ratio of the “Vertical Change” to the “horizontal change” between (any) two distinct points on Line. Sometimes the ratio is expressed as quotient (rise over run), giving the same number for every two distinct Points on the same line. line that is decreasing has a negative rise,
(L. Eikvil, K. Aas, and H. Koren.1995).
The line may be practical as set by a road surveyor, or in a diagram that models a road or roof either as a description or as a plan:
1-The direction of a line is increasing, decreasing, horizontal or vertical.
2 – A line is increasing if it goes up from left to right. The slope is positive, i.e. m>0.
3- A line is decreasing if it goes down from left to right. The slope is negative, i.e. m<0.
4- If a line is horizontal the slope is zero. This is a constant function.
5 –If a line is vertical the slope is undefined (see below).
6- The steepness, incline, or grade of a line is measured by the absolute value of the Slope.
7-Slope with a greater absolute value indicates a steeper line.
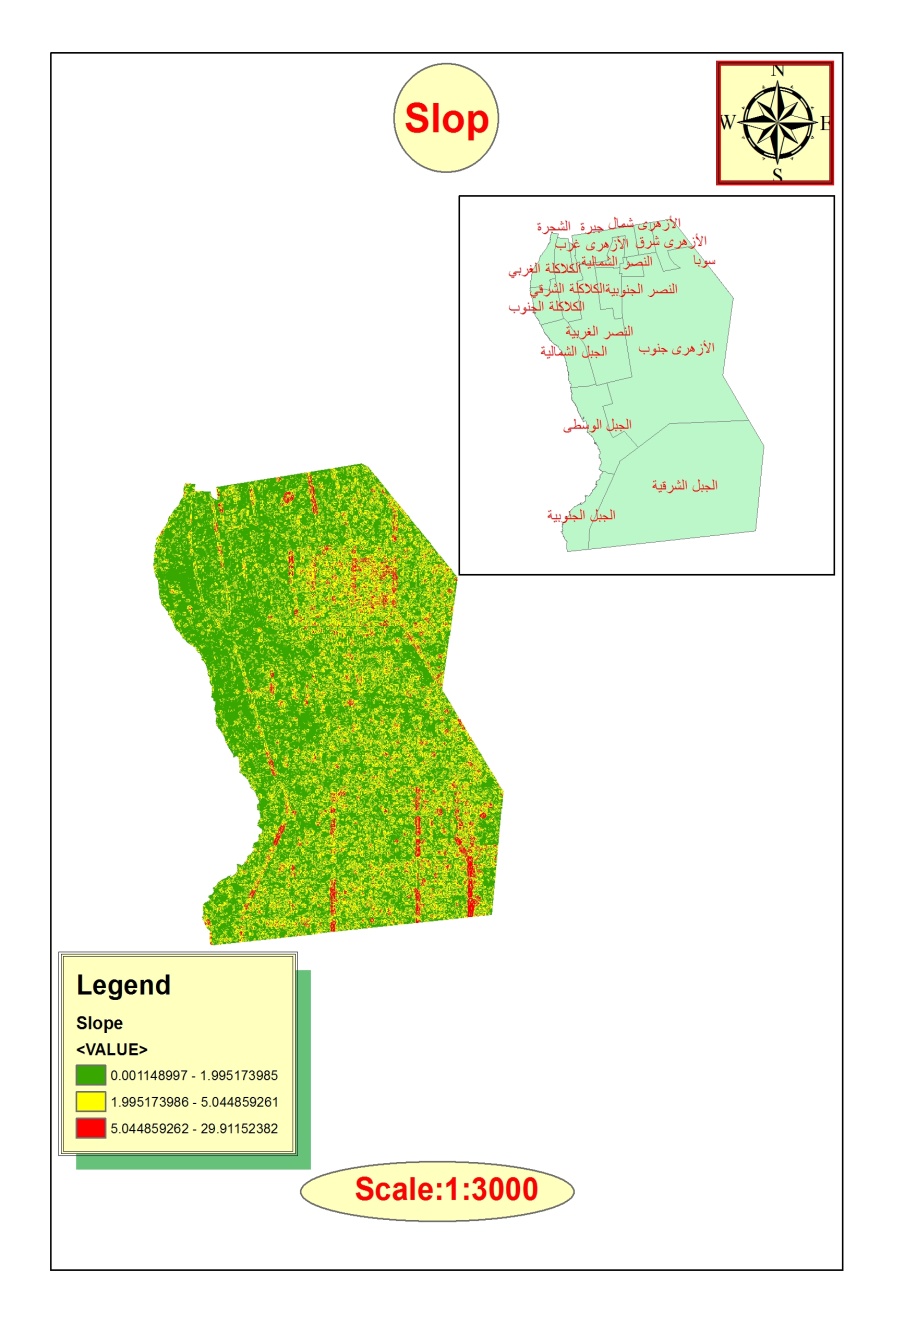 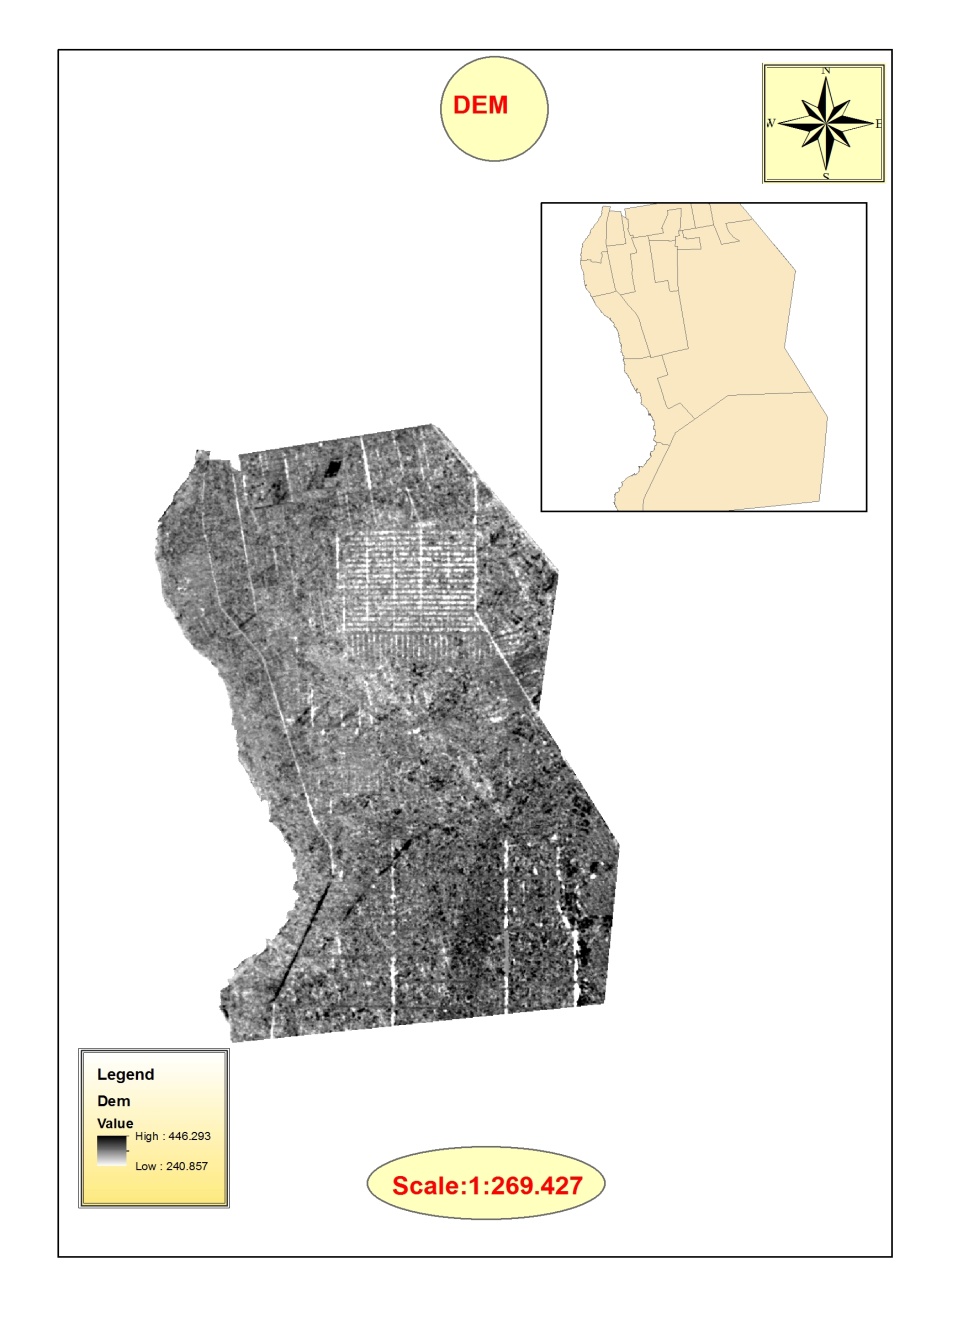 |
Figure (7): Dem and Slope. Source (Author.2021)
10-3-Aspect
Identifies the down slope direction of the maximum rate of change in value from each cell to its neighbors, it can be thought of as the slope direction. The values of each cell in the output raster indicate the compass direction that the surface faces at that location. It is measured clockwise in degrees from 0 (due north) to 360 (again due north), coming full circle. Flat areas having no down Slope direction are given a value of the value of each cell in an Aspect dataset indicates the direction the cell’s slope faces, (R. Samet, I. Askerzade, and C. Varol.2010).
The study area has been cut from Aspect data, following figure (8).
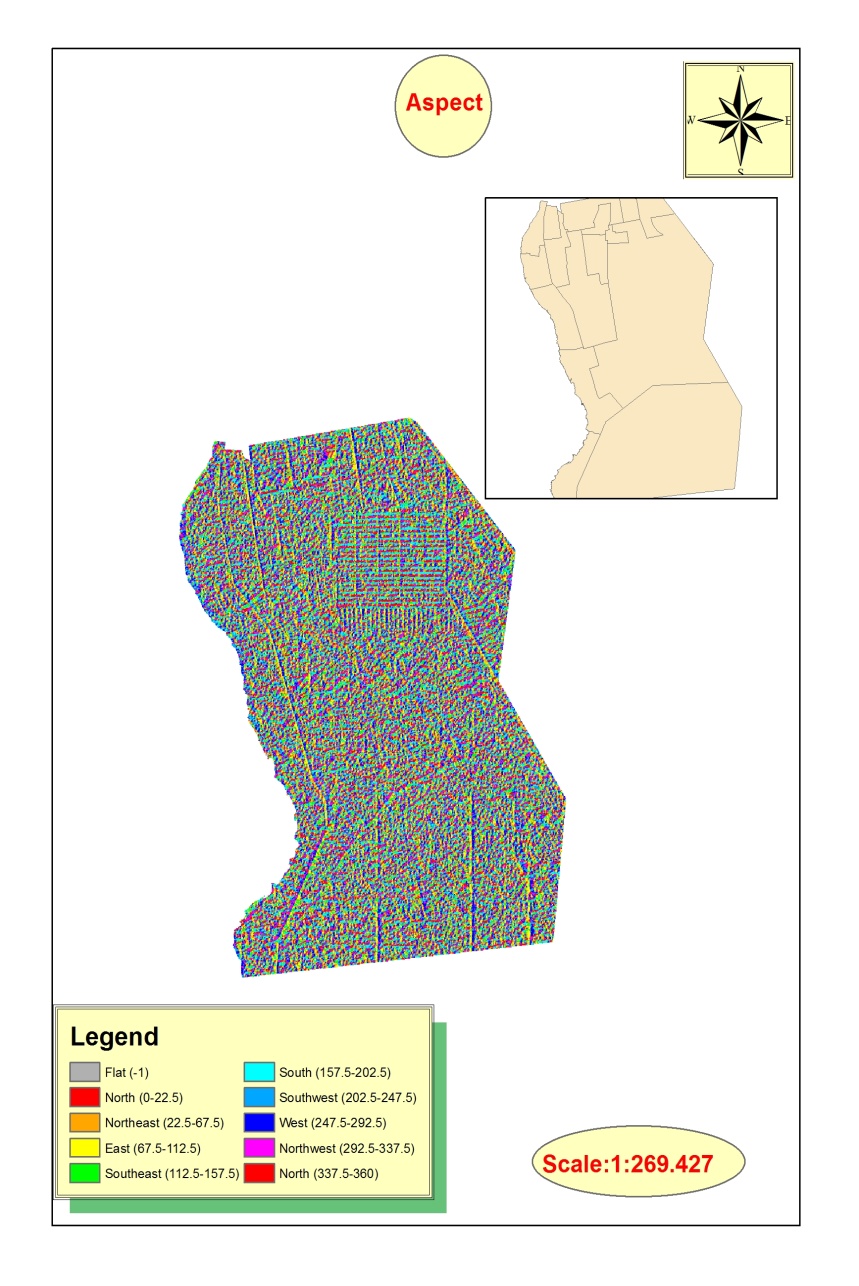
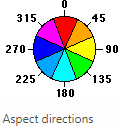
Figure (8): Aspect. Source (Author.2021)
10-4-Contour lines
Is the imaginary curved line has fixed level on the surface of the earth and is produced by horizontal plane intersection Imaginary with the earth’s surface and reaches all points of one Level.
10-4-1-Characteristics of contour lines
Contour lines have the following characteristics:
1- It retreats towards the water dispensers.
2- The distance between the contour line and another is the vertical distance fixed on the surface of the earth.
3-Which the convergence of contour lines indicates the intensity of the slope and its divergence indicates a slight decline, following figure (9).
4 -Contour lines do not intersect unless there is cave, (Ganpatrao and J. K. Ghosh.2014).

Figure (9): contour lines. Source (Author.2021)
10-5-Separator contour
This is the vertical distance between the contour line and the next line, this difference may be in meters or feet depending on the type of measurement, Kilometers or miles, following figure (10).

Figure (10): Separator contour. Source (Author.2021)
10-5-1-Slopes in the ground
The slopes have a clear effect on plant, animal and urban life they determine the Shape of Water drainage patterns and are responsible for soil erosion, transport Routes and contour maps that show us the slope and intensity gradients can be divided by gradient to:
- Gentile slope
In which the lines of contour away from each other following figure (11). Description of the Contour in study area.
The contour void between max-min of the highest Level Lower top right side, the ground slow varied in flat level, (D. B. Dhar and B. Chanda.2006)
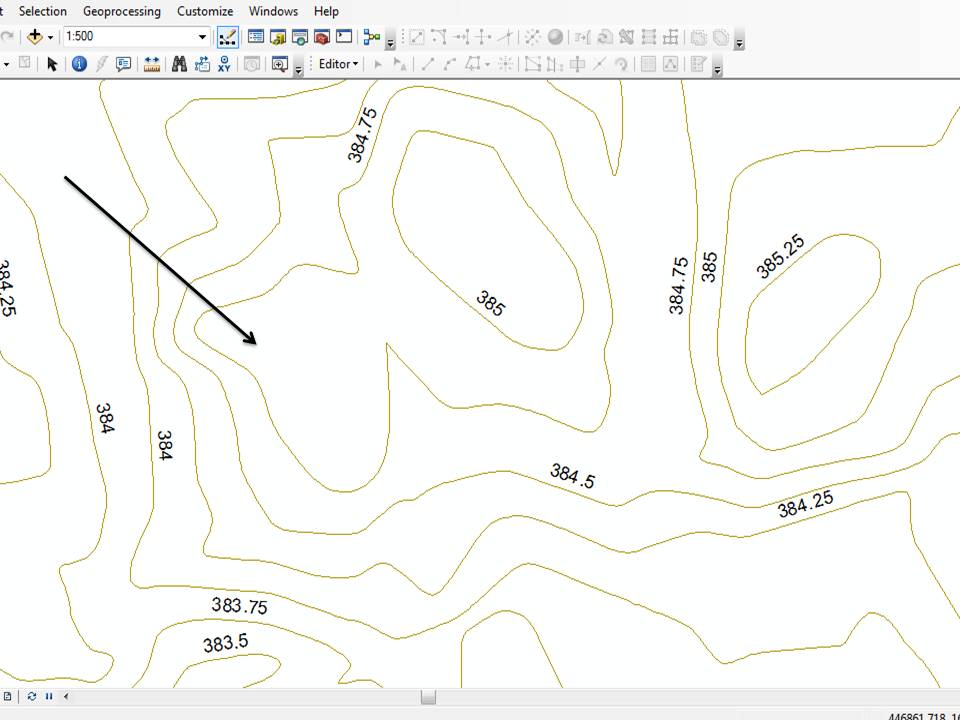
Figure (11): Gentile slope. Source (Author.2020)
- Steep slope
In which the lines of contour approaching each other following
figure (12).
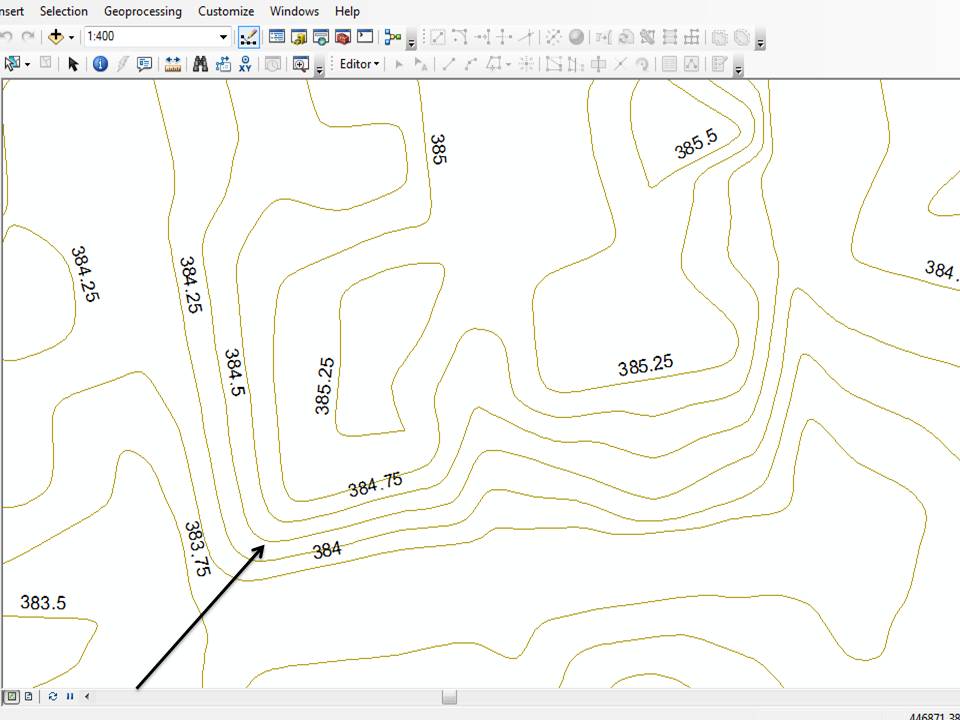 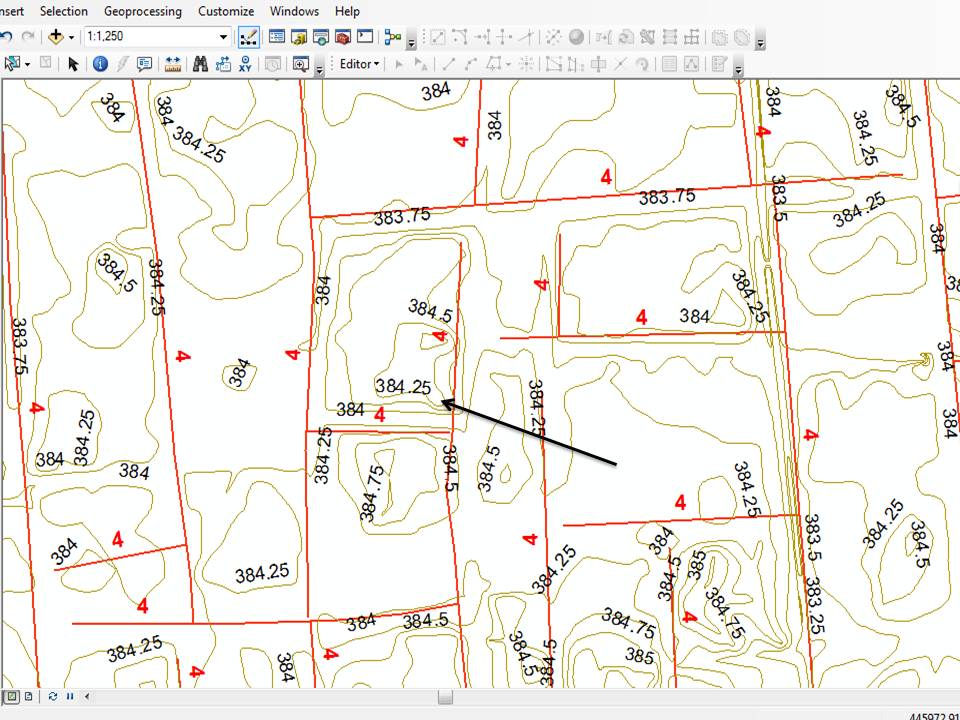 |
Figure (12): Steep slope& slope in pipeline. Source (Author.2020)
The following figure shows the placement of water pipes in the slope, following figure (12).
Description of pip liens in the relation to slope:
The plotting of pipe lines showing the chard relationship between the slope and pipe lines the will help in determining the design of pipe lines and also will help to relate to water directions.
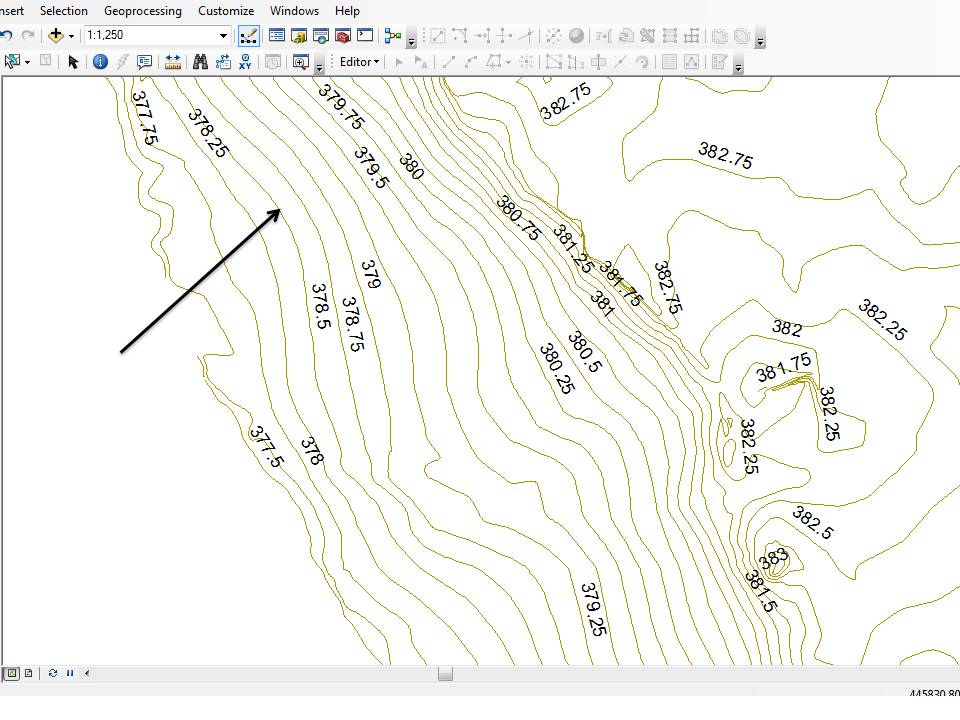
- Moderate slope
A middle stage between the two previous following figure (13).
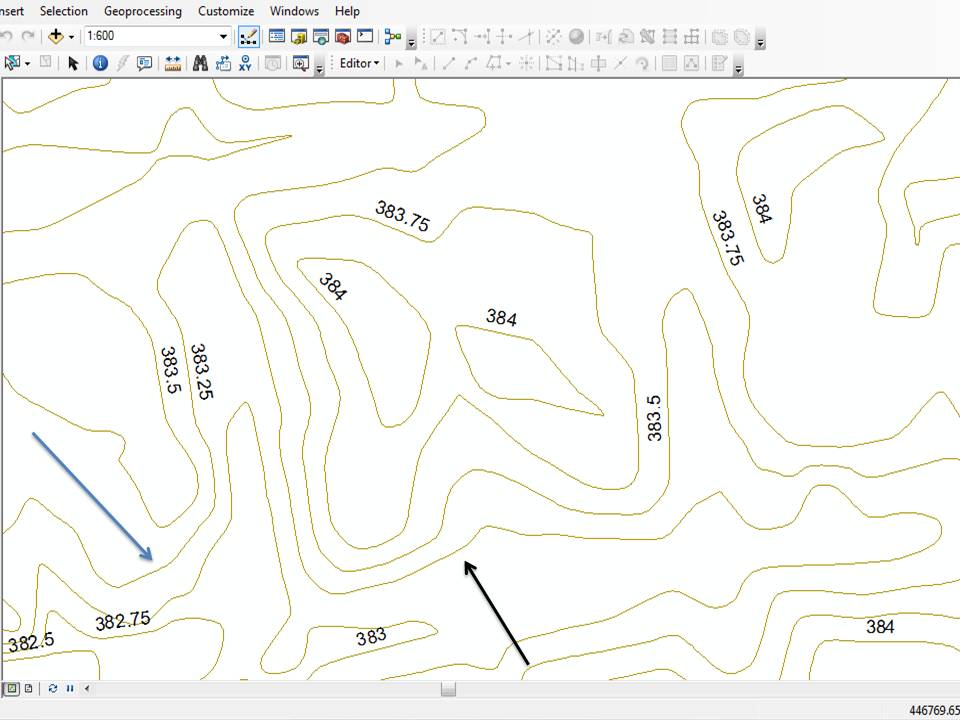  |
Figure (13): Moderate slope
10-5-2-Representation of the contour of the events of the conflict
Contour maps represent the different histrionic forms of the earth’s earth the following is more significant representation these phenomena are like you.
following is study of the study area in detail and there are many types of forms of slopes:
- hill
It is a high ground with a height of less than 1000 m, it is steeped in slope, where it starts with Steep slope from the bottom and ends at the top with a slight slope, (R. Pradhan, S. Kumar, R. Agarwal, M. P. Pradhan, and M. K.2010), following figure (14).
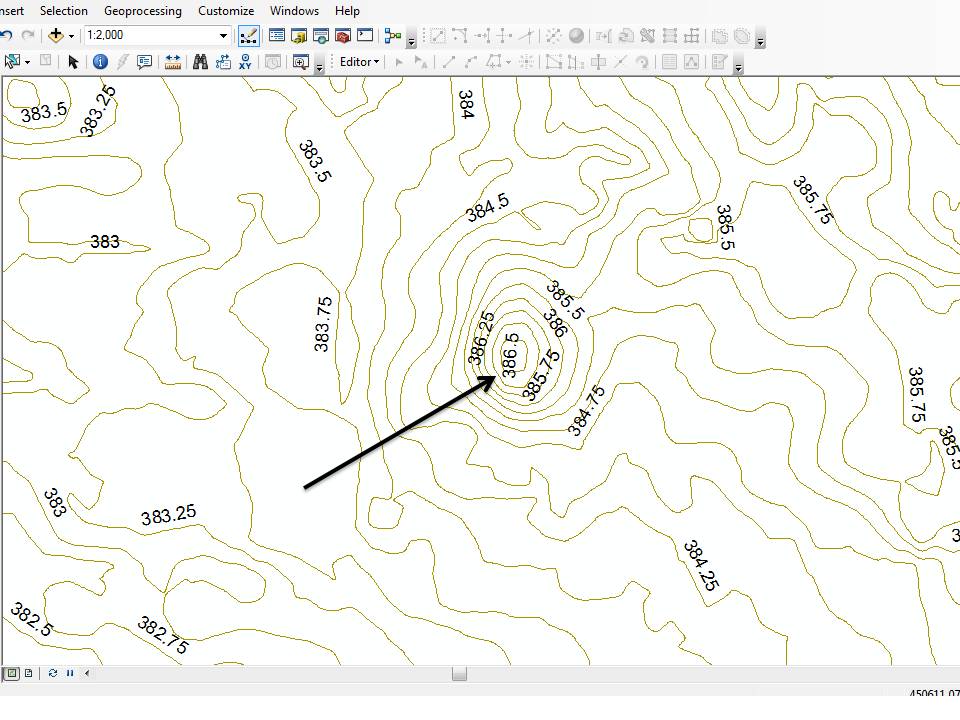 |
Figure (14): hill: Source (Author.2021)
The following figure (15) shows the placement of water pipes in the slope.
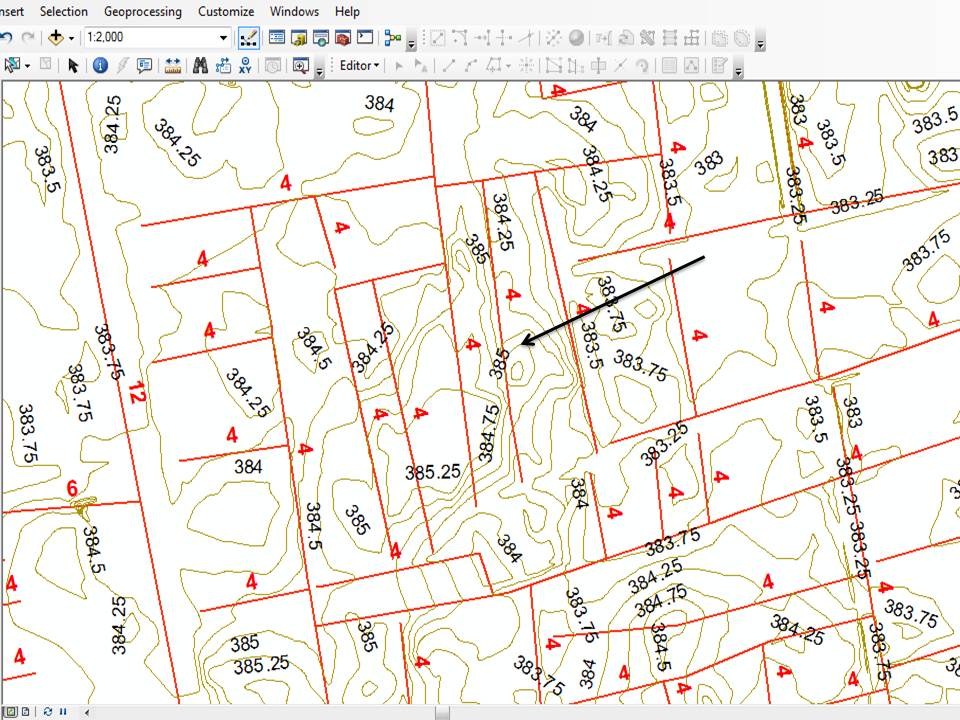
Figure (15): hill with pipelines. Source (Author.2021)
The same shape in the study which indicates the existence of many slopes which affect the effect of the process of water payment within the pipes the following figure illustrates Model of the slopes of the study area.
- The Knoll
it is a relatively small hill, separated from the neighboring land, showing contour Lines Closed and separate, (A. Khotanzad and E. Zink.2003), the following figure (16) shows the placement of water Pipes in the slope.
 |
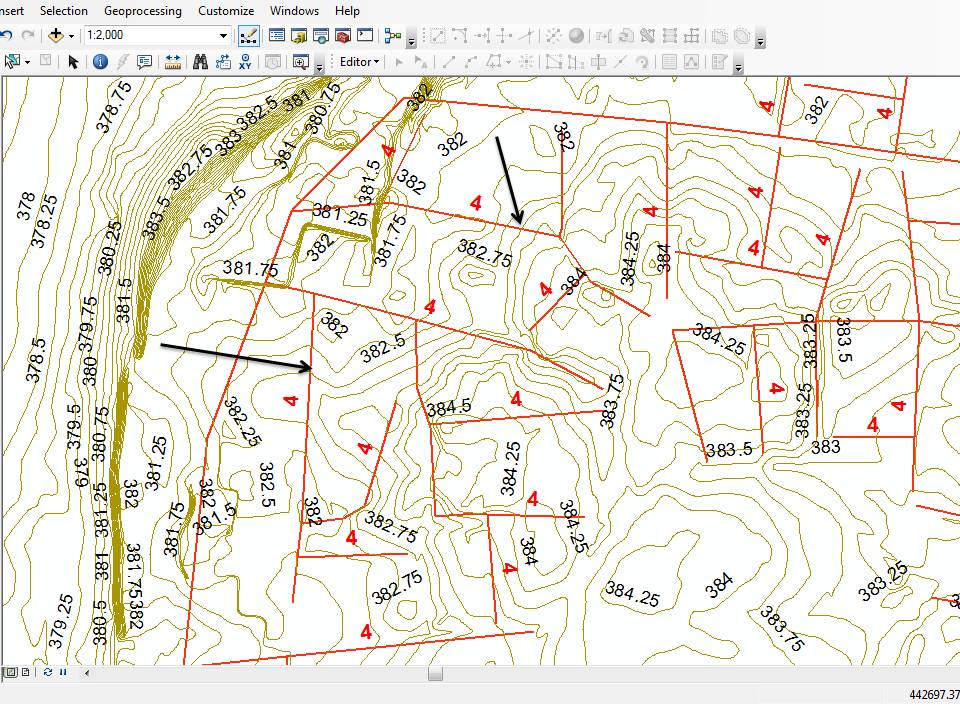 |
Figure (16): knoll with pipelines. Source (Author.2021)
The following figure (17) shows the placement of water pipes in the slope.
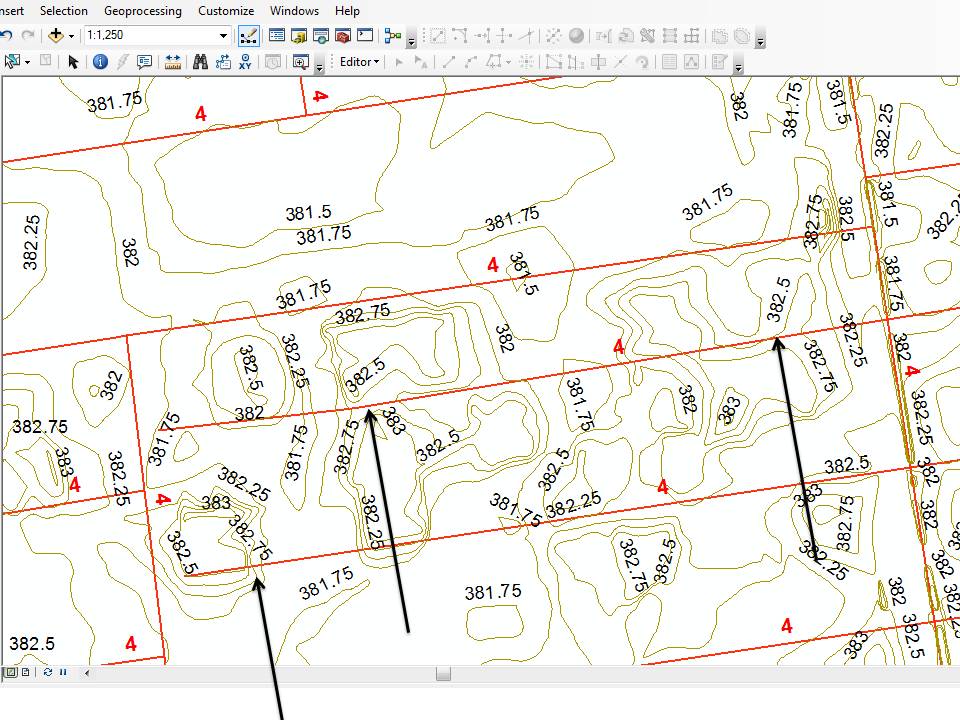
Figure (18): Promise with pipelines. Source (Author.2021)
- Mountain with two peaks
Is mountain with two peaks between them neck and neck is drop between the peaks of the Mountain, following figure (19).
 |
Figure (19): Mountain with two peaks. Source (Author.2021)
- Mountain Corridor
It is low between two high regions and not between two peaks following figure (20).
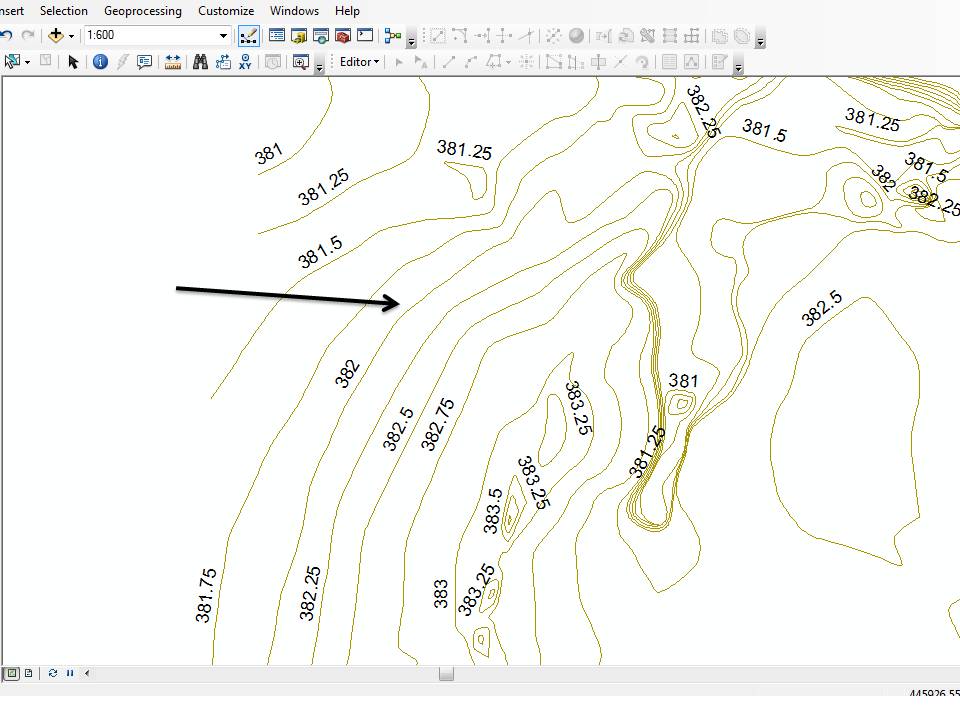 |
Figure (20): Mountain Corridor. Source (Author.2021)
The corridor is clear in the area some precautions shod be taken in consideration to avoid any Weakness in water supply in this area.
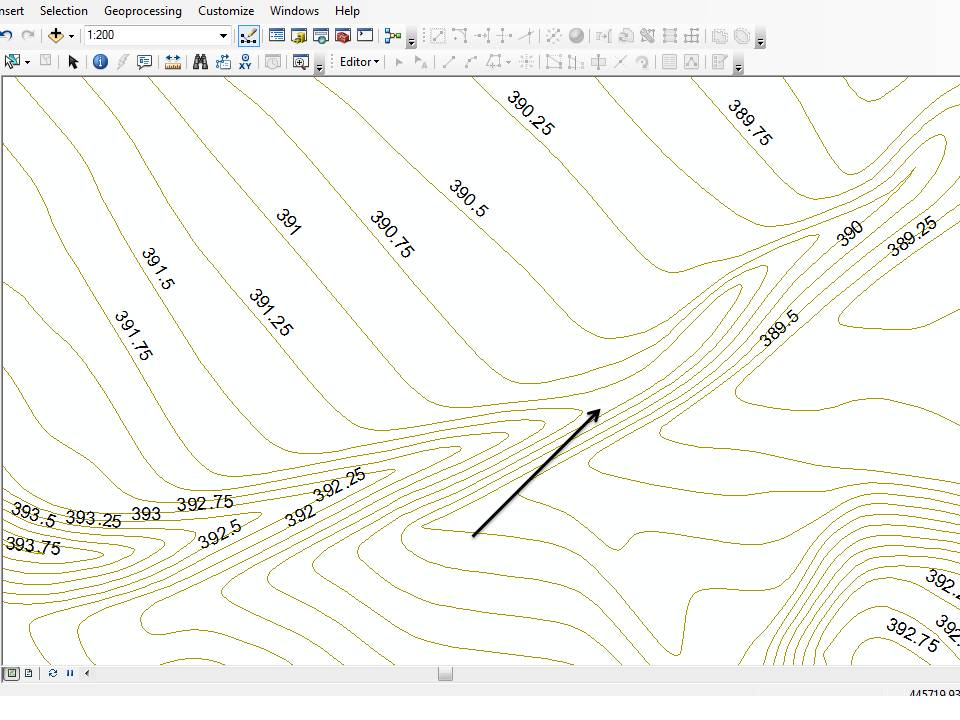
- Shelf
It is sudden drop in the surface of the earth descending at an angle and the lines converge the edge of the cliff, the following figure (21) shows the placement of water pipes in the shelf.
 |
 |
Figure (21): Shelf with pipelines. Source (Author.2020)
The models mentioned in the pictures are not restricted and the study area contains many terrain slopes, cages and for contour lines elevation. The shelf phenomena consider for the as slope thin need good management for pipe lines management.
11-RESULT AND DISCUSSION
The general benefit of GIS applications is that they offer their users an answer to the models of Questions, to access solutions that discuss both location and condition conditions and form model, and then take advantage of them to answer the previously identified Questions.
Use of contour lines analysis that illustrate the heights and low of earth and DEM, analyzing water line networks using of tool utility network analyst.
12-Conclusion
GIS technology is very important and provides high potential in analysis and ability to predict future and help in making the necessary decisions associated with performance within organizations which is equivalent to full satisfaction with the futures of the service.
Researcher in the field of information systems geography to difficult obtaining the spatial database that he needs in the research where government agencies retain their spatial data and only provide the researcher with a manual map and then the researcher to build spatial base for unit of conclude from the study the following:
1. Know the heights and lows of the study area through the contour lines.
4. The ability to distribute the database in all water offices within the study area.
5. Water distribution and handling is easier and more efficient, quickly find solutions and make the right decision.
13-Recommendations
The fallowing recommendation can be listed as fallowing:
1-Establish of geographical database of all water sanitation and electricity networks to Ensure No interference in these networks in the future and to provide returnable base if you Want to update and the development of these infrastructures.
2-On government service institutions to help researchers and provide them with Spatial Data shape file GIS.
3-Apply advance analysis of the GIS to understand the relationship between all parameter Affects water network system.
Conflict of Interests
The author declares that there is no conflict of interests regarding the publication of this paper.
Acknowledgment
This work was supported by data form Khartoum State Water Authority and the Ministry of Urban Planning of Khartoum State.
References
1- Tutorial 1, piping system online
https://theconstructor.org/environmental-engg/water-distribution-system-layout/21217/
2- (Dr. Gamma Dawood 2014), Fundamentals of Spatial Analysis in GIS King Saud University
3- (Tutorial 2, ESRI ARC GIS website online)
4- WaterAid (2011). Water point mapping.
http://www.waterpointmapper.org
5- Caitlin Dempsey | June 12, 2015 | GIS Learning.
S. Spinello and G. Pascal, “Contour line recognition from scanned topographic maps,” Journal of Winter School of Computer Graphics, 2004.View at: Google Scholar
6- P. Arrighi and P. Soille, “From scanned topographic maps to digital elevation models,” in Proceedings of the International Symposium on Imaging Applications in Geology (GeoVision ’99), Belgium, May 1999.View at: Google Scholar.
7- L. Eikvil, K. Aas, and H. Koren, “Tools for interactive map conversion and vectorization,” in Proceedings of the 3rd International Conference on Document Analysis and Recognition,IEEE, Montreal, Canada, August 1995.View at: Publisher Site | Google Scholar
8- R. Samet, I. Askerzade, and C. Varol, “An implementation of automatic contour line extraction from scanned digital topographic maps,” Applied Mathematics and Computation, 2010.View at: Google Scholar
9-N. G. Ganpatrao and J. K. Ghosh, “Information extraction from topographic map using color and shape analysis,” Sadhana, 2014.View at: Publisher Site | Google Scholar
10- D. B. Dhar and B. Chanda, “Extraction and recognition of geographical features from paper maps,” International Journal on Document Analysis and Recognition 2006.View at: Publisher Site | Google Scholar.
11- R. Pradhan, S. Kumar, R. Agarwal, M. P. Pradhan, and M. K. Goose, “Contour line tracing algorithm for digital topographic maps,” International Journal of Image Processing, 2010.View at: Google Scholar.
12-A. Khotanzad and E. Zink, “Contour line and geographic feature extraction from USGS color topographical paper maps,” IEEE Transactions on Pattern Analysis and Machine Intelligence, 2003.View
at: Publisher Site | Google Scholar.
13-Y. Chen and R. S. Wang, “Contour lines recognition from scanned topographic maps,” Computer Aided Engineering, 2005.View at: Google Scholar
