

Mohammedelmoez E.A. Mokhtar *, Mohamed E. Gar-Alnabi1, Nadia O. M. Elata2, Amgad Kh O Nasr3
* Forensic Evidence Administration, Sudan Police Force HQ, Ministry Of Interior, Sudan
1 Sudan university of Science& Technology, College of Medical Radiologic Sciences, National University –Sudan, Faculty of Radiography& Medical Imaging Science
2 National Ribat University –Sudan, Academic Affairs
3 Al-Neelain University – Sudan, Medical Physics Department
*Correspondence e mail: mmmoez@gmail.com, mmmoez@yahoo.com Email:
HNSJ, 2022, 3(10); https://doi.org/10.53796/hnsj3108
Published at 01/10/2022 Accepted at 11/09/2022
Abstract
The radionuclide activity and the fraction of injected activity in the kidneys have been measured experimentally using Scintillation Camera Planar Imaging Techniques by using formula derived from the formalism of the Medical Internal Radiation Dosimetry committee, practical data collected from Radiation and Isotope Center of Khartoum, Nuclear Medicine and Oncology Center, Shendi University, Department Of Nuclear Medicine National Cancer Institute, University of Gazira Wad Medani, Department Of Nuclear Medicine, Royal care International Hospital, Al-Nilain Diagnostic Center- Khartoum, which covers all Sudanese region, using MedisoInterViewXP® software. The aim of the study is to make a relationship between radionuclide activity in kidneys and the body mass index during bone scan among Sudanese patients. The sample of study were randomly selected from available data in sites, it contains 148 patients referred to Gamma Camera Unit, undergoing of bone scan 3 h after injection of average activity of 20.1 mCi methylenediphosphonate (MDP). The radionuclide activity for the kidneys was found in bone scan (0.07 mCi). The study also found that (1.45%) of the injected dose remained in the kidneys three hours post injection, which reflects that low radiation dose was received by the kidneys during bone scan using 99mTc-MDP. The body mass index (BMI) was calculated for each patient, and then a graph between kidneys radionuclide activity and the (BMI) was made by using Windows Microsoft Excel program, and the equation of the relationship was made.
The radionuclide activity of kidneys decreases by 0.001percent/ kg/ of body mass index BMI, start at 0.08 (mCi).
The fraction of radionuclide activity of kidneys decreases by 0.001percent/ kg/ of body mass index BMI, start at 1.7 %, and that radionuclide activity and fraction radionuclide activity in kidneys is decrease with patient body mass index (BMI) increase.
Key Words: Gamma Camera, Nuclear medicine, internal dosimetry, radiopharmaceuticals
Introduction/Background:
Radiopharmaceuticals used in diagnostic and therapeutic nuclear medicine are generally delivered to the patient via intravenous injection. Because the kidneys serve as the major excretory organ of the body where toxins, metabolic wastes, and excess ions are removed from the bloodstream, radioactivity uptake and local tissue irradiation will consistently be observed in this organ. Other organs, such as the liver or the spleen, concentrate radioactive materials fairly uniformly at the macroscopic level. However, because of its unique physiology, the kidneys are seen to concentrate radioactivity nonuniformly [1-3]. For materials that are readily filtered by the kidneys, radioactivity is initially concentrated within the renal cortex, followed by sequential concentration in the outer medulla, inner medulla, papillae, and renal pelvis. After absorption of water in the inner medulla, radioactivity is intensely concentrated within the papillary ends of the medullary pyramids. Other substances, however, may bind to the tissues of the renal tubules, and, thus, persistent concentrations of radioactivity can be seen in the renal cortex. [4] Kidney dosimetry is typically conducted using single-region models that require the assumption of a uniform activity concentration and permit only the estimate of the mean absorbed dose to the organ [5]
A bone Scan or scintigraphy is a nuclear medicine test to find certain abnormalities in bone; it is primarily used to help diagnose a number of conditions relating to bones [6]
The role of internal dosimetry in diagnostic nuclear medicine is thus to provide the basis for stochastic risk quantification. Once this risk is quantified, it may be used to optimize the amount of administered activity in order to maximize image quality while minimizing patient risk. This optimization is considered, and always evaluated for any imaging procedure [7]
The WHO has confirmed that the body mass index (BMI) is a reliable and convenient way of assessing the relationship between an adult’s body mass and height [8].
Body mass index (BMI) is a universally used unit of measurement expressed as kg /. It is therefore calculated by dividing an individual’s mass in kilograms by the square of their height in meters [9]
In 1993, the WHO assembled an Expert Consultation Group with a charge of developing uniform categories of the BMI [10]. Four categories were established: underweight, normal, overweight, and obese. An individual would be considered to be underweight if his/her BMI was in the range of 15 to 19.9, normal weight if the BMI was 20 to 24.9, overweight if the BMI was 25 to 29.9, and obese if it was 30 to 35 or greater [11]. The sample of patients was classified on the four (BMI) categories underweight, normal, overweight, and obese.
The main objective of this study is to show the relationship between the radionuclide activity, the fraction of injected activity in the kidney and body mass index (BMI) during the Nuclear Medicine scans specifically bone scan among Sudanese patients, using Scintillation Camera Planar Imaging Techniques to measure radionuclide activity in the kidneys. Most scintillation camera systems used in clinical nuclear medicine are computer-based and provide software for generation of ROIs and statistical analysis [12], and calculate the body mass index (BMI) from biodata of the sample, then obtain the relationship by using Windows Microsoft Excel program.
Materials and Methods:
The data of this study was collected from the five main centers of Nuclear Medicine in Sudan: Radiation and Isotope Center of Khartoum, Nuclear Medicine and Oncology Center, Shendi University, Department Of Nuclear Medicine National Cancer Institute, University of Gazira Wad Medani, Department Of Nuclear Medicine, Royal care International Hospital, Al-Nilain Diagnostic Center- Khartoum, which covers all Sudanese regions, The sample of study were randomly selected from available data in sites, it contain 148 patients, undergoing of bone scan, 3 hrs post injection of average activity of 20.1 mCi of methylenediphosphonate (MDP). Single photon emission computed tomography (SPECT) system (Mediso manufacture) was used for performing bone scans on patients as employed in studies, the data was obtain by using Scintillation Camera Planar Imaging Techniques, and calculated radionuclide activity for the kidneys by using formula derived from the formalism of the Medical Internal Radiation Dosimetry committee (MIRD), the biodata for patients was obtained include the weight and height of patients, Quantitative analyses were performed on images acquired by drawing region of interests (ROIs) by the system’s software application Mediso / Medical Imaging systems –InterView XP, for the kidneys, also for whole body, anterior and posterior, and tabulating counts of radionuclide activity, the average counts were calculated from the conjugate view counting by using geometric mean count equation : GMC = where and are the anterior and posterior counts respectively, then the count of right Kidney and left kidney were calculated and the average kidney count was obtained, the fraction of counts in kidneys was calculated from whole body count, and then the radionuclide activity in kidneys was estimated by looking for an average of injected dose with the whole body counts and compare the fraction of activity in kidneys with that ratio, and the counts were converted into radionuclide activity (mCi) [13]. Also the body mass index (BMI) was calculated for each patient by dividing an individual’s mass in kilograms by the square of their height in meters, then a graphs between radionuclide activities and fraction radionuclide activities in kidneys and the (BMI) were made by using Windows Microsoft Excel program, and the equation of the relation were made. Also the sample of patients was classified on the four (BMI) categories: underweight, normal, overweight, and obese.
Fig (1) Show Biokinetic Model for () MDP for Bone scan [14]
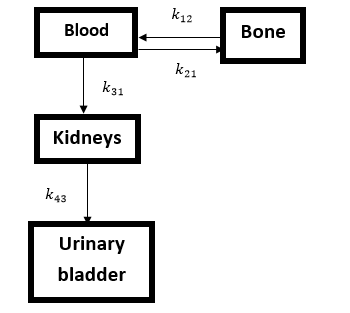
Compartment 1 represents blood and extracellular fluid (ECF); compartment 2, bone; compartment 3, kidneys; and compartment 4, urine.
Results and Discussion:
Radionuclide activity in kidneys
The study found that the experimental measured radionuclide activity in kidneys in bone scan for 148 patients 3 hrs post injection average of activity 20.1 mCi of MDP was (0.07 mCi). The study also found that (1.45 %) of the injected dose remained in the kidneys in bone scan, which reflects that low radiation dose was received by the kidneys and bladder during bone scan using 99mTc-MDP.
The sample of patients was classified on the four (BMI) categories as:
| underweight | normal | overweight | obese |
| 17% | 32% | 26% | 25% |
This reflected that the sample of the study contains all four (BMI) categories.
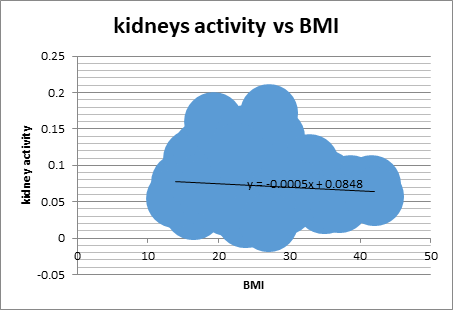
Relationship between kidneys radionuclide activity and the (BMI)
The graph contains the radionuclide activity in kidneys (mCi) in Y -axis and the (BMI) (kg /) in X -axis is:
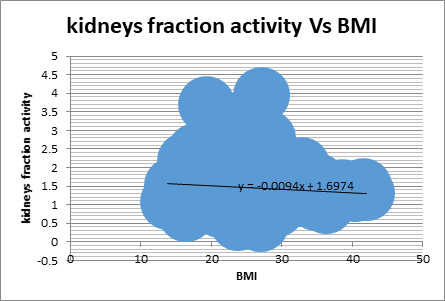
Relationship between fraction of kidneys radionuclide activity and the (BMI)
The graph contains the fraction of radionuclide activity in kidneys (mCi) in Y -axis and the (BMI) (kg /) in X -axis is
Conclusions:
The results of the study showed that the radionuclide activity of kidneys decreases by 0.001percent/ kg/ of body mass index BMI, start at 0.08 (mCi).
The fraction of radionuclide activity of kidneys decreases by 0.001 percent/ kg/ of body mass index BMI, start at 1.7 %, and that radionuclide activity and fraction radionuclide activity in kidneys are decrease with patient body mass index (BMI) increase.
Acknowledgment:
I would like to give my thanks to administration and staff of the five centers of Nuclear Medicine in Sudan, for their helpful stand in data collection, Radiation and Isotope Center of Khartoum, Nuclear Medicine and Oncology Center, Shendi University, Department Of Nuclear Medicine National Cancer Institute, University of Gazira Wad Medani, Department Of Nuclear Medicine, Royal care International Hospital, Al-Nilain Diagnostic Center- Khartoum.
Reference:
- McAfee JG. Problems in evaluating the radiation dose for radionuclides excreted by the kidneys. In: Cloutier RJ, Edwards CL, Snyder WS, eds. Medical Radio-nuclides: Radiation Dose and Effects. Oak Ridge, TN: U.S. Atomic Energy Commission; 1969:271–294.2.
- Willis KW, Martinez DA, Hedley-Whyte ET, Davis MA, Judy PF, Treves S. Renal localization of99mTc-stannous glucophetonate and99mTc-stannous dimer-captosuccinate in the rat by frozen section autoradiography: the efficiency and resolution of technetium-99m.Radiat Res.1977;69:475–488.3.
- Bonnin F, Petegnief Y, Petiet A, Stievenart JL, Colas-Linhart N, Bok B. Tissularkinetics of radiopharmaceuticals (Rph) in the rat kidney using a radioimager (Ri) [abstract].J Nucl Med.1998;39(suppl):185P.
- MIRD Pamphlet No. 19, Bouchet et al, (2003) “Absorbed Fractions and Radionuclide S Values for Six Age-Dependent Multiregion Models of the Kidney”, THE JOURNAL OF NUCLEAR MEDICINE •Vol. 44•No. 7•July 2003, pages: 1113-1114
- Cristy M, Eckerman KF.Specific Absorbed Fractions of Energy at Various Agesfrom Internal Photon Sources.ORNL/TM-8381/Vols. I–VII. Oak Ridge, TN:Oak Ridge National Laboratory; 1987.
- DaryoushShahbazi‑Gahrouei, Mohsen Cheki1, MasoudMoslehi, “Estimation of Organ Absorbed Doses in Patients from 99mTc‑diphosphonate Using the Data of MIRDose Software”, Short Report , Journal of Medical Signals & Sensors, Vol 2 | Issue 4 | Oct-Dec 2012, page: 231
- IAEA, (2011), “Report of a consultancy meeting”, International Atomic Energy Agency, Vienna: IAEA. held 26-28 September 2011
- Frank, Q.N. Body Mass Index Obesity, BMI, and Health: A Critical Review. Nutr. Today 2015,50, 117–128
- Chen Ding and Yumei Jiang, 2020, The Relationship between Body Mass Index and Physical Fitness among Chinese University Students: Healthcare 2020,8, 570; doi:10.3390/healthcare8040570, This article is an open access article distributed under the terms and conditions of the Creative Commons Attribution (CC BY) license (http:// creativecommons.org / Licenses / By /4.0/)
- WHO. Physical Status: The Use and Interpretation of Anthro- pometry: Report of a World Health Organization (WHO) Expert Committee. Geneva, Switzerland: World Health Organization; 1995
- Frank Q. Nuttall, 2015, “Body Mass Index Obesity, BMI, and Health: A Critical Review” Nutrition Today journal’s \ Volume 50, Number 3, May/June 2015, page 119
- MIRD16, Jeifry A. Siegel, el at, (1999) “Techniques for Quantitative Radiopharmaceutical Biodistribution Data Acquisition and Analysis for Use in Human Radiation Dose Estimates”, THE JOURNALOFNUCLEARMEDICINE, Vol. 40 . No. 2 (Suppl) page 415
- Mohammedelmoez, 2022, “Measurement of Organs dose during Nuclear Medicine Scans in Sudan”, study of a thesis submitted for fulfillment of the requirements of the PhD in medical physics. Al-Neelain University – College of Graduate Studies.
- MIRD13, David A. Weber, el at, (1989) “Radiation Absorbed Dose from Technetium-99m-Labeled Bone Imaging Agents”, THE JOURNALOFNUCLEARMEDICINE, Volume 30 Number 6 , page 1119