Ans Elmeshri, Akram Alkasih, Ahmed Torkman, Salem Abdullah Mahmud, Ala Juma Bader
The Libyan Center for Remote Sensing and Space Science
Email: ans.elmeshri@lcrsss.ly
HNSJ, 2023, 4(10); https://doi.org/10.53796/hnsj4101
Published at 01/10/2023 Accepted at 05/09/2023
Abstract
Wireless communication service provider companies enable subscribers to use the services such as telephony or internet services at any time and almost anywhere. However, with the increasing demand of the mobile data usage including new internet applications like Multimedia streaming, real time gaming, and mobile TV, the mobile telecom network planning becomes a challenge especially for densely populated cities in terms of coverage and capacity requirements.
Atoll from Forsk, is the most RF network planning and optimization used software for research and commercial purposes. For better results from the software, it requires geospatial data and maps including the elevation of the earth, clutter classes, and clutter heights. In addition, vector data also needed to perform some computations.
Remote Sensing (RS) and Geographical Information System (GIS) techniques have been successfully used and widely in variety of applications including land cover land use mapping.
In this paper, we have simulated the LTE Libyana company mobile network at part of the city of great Tripoli using Atoll software. The clutter classes map of the land classification is well created from 10m Sentinel 2 European satellite images using unsupervised classification technique. Clutter heights map is generated by digitizing the high resolution Pleiade satellite image and adding the building heights using ArcGIS software. Some network data and parameters on sites, transmitters, and cells were provided from the service provider company “Libyana”.
The simulation results indicate that the study area required more than 47 sites, the simulations display a received signal power level of less than -90 dB in almost all the entire area of interest.
Key Words: clutter classes, remote sensing, GIS, Atoll, mobile network.
Introduction
Remote sensing technology and GIS system are extremely powerful tools which are used in many applications. They have been widely and successfully applied for earth surface observation, land cover classifications, fractional vegetation cover, and urban growth and city management. Such applications can be applied in variety of fields such as agriculture, forestry, and cartography. The integration of information extracted through Remote Sensing and GIS with other datasets provides tremendous potential for identification, monitoring and assessment of sustainable development projects [1].
Digital Elevation Models (DEMs) are the digital representation of the earth surface elevation with respect to the sea level. They are commonly built using data collected using remote sensing techniques or built from earth surveying. DEM is created by different methods including: Conversion of printed contour lines where the elevation contours are tagged with elevations then an algorithm is used to interpolate elevations at every grid point from the contour data, photogrammetry where an instrument calculates the parallax displacement of a large number of points.
DEMs are used across several areas of development including water resources management, determining surface water flow, disaster and flood risk simulation and management, infrastructure planning and mapping, road design and construction for transportation, urban environment planning, and Telecommunication network planning. [2, 3]
Long Time Evolution (LTE) is a wireless communication with high speed data for mobile use. It’s technology based on the GSM/EDGE and UMTS/HSPA network infrastructure. LTE is developed for number of frequency bands ranging from 800MHz to 3.5MHz with flexible bandwidths between 1.25MHz to 20MHz, and support both Time Division Duplex (TDD) and Frequency Division Duplex (FDD). For downlink and uplink, LTE uses orthogonal frequency division multiple access (OFDMA) and single carrier frequency division multiple access (SC-FDMA) with data rates 100Mb/s and 50Mb/s respectively [4].
ATOLL is a RF network simulation tool that is widely used to realize dimensioning and coverage by mobile network [5], it supports many RF techniques including GSM/GPRS/EDGE, UMTS/HSPA, LTE, WiMax 802.16, and microwave radio link. The software has a very friendly working environment, the geographical and rf network layers include maps and data (raster, vector, and tables) can be import and use in different type of formats, also, the simulation results for multiple coverage prediction and network capacity can be export with multi formats which can be read with other software.
Literature Review
Nowadays, especially in dense areas, mobile networks must has good signal coverage everywhere, and intend to provide efficient support of various services (VoIP, web browsing, multimedia streaming) with high data transfer speeds and wide bandwidth.
There have been several works done on the mobile network dimensioning and planning recently, many thesis and published articles related to our work.
Reshma and Chaitanya simulated GSM mobile networks planning using Atoll software [6].
Paul and Subani did simulation exercises on planning of 3G UMTS network with Atoll planning tool, they simulated the coverage prediction, quality and capacity of UMTS network which uses WCDMA in radio interface between 3G base station and the user equipment [7].
Raphael and Emmanual used Atoll to simulate the LTE network at 1800 MHz band on 20 MHz channel in the capital of Cameroon Yaounde, they used COST-231 propagation model to simulate coverage prediction and capacity planning based on a service and traffic models, they showed that the 183 km2 city needs 244 LTE sites for full coverage. [8]
Amevi and his workmate used LTE smart planner model for LTE network dimensioning including coverage and capacity planning. They tried to optimizing coverage and capacity planning by developing and analysing model based on link budget calculation [9].
Elfeghi, … calculated the dimension of a LTE network including frequency, coverage and capacity in order to prepare a mobile planning guideline considering possible network implementation in the city of Tripoli, they simulated uplink and downlink to get a closer view to the impact of the signal to noise ratio (SNR) on bit error rate (BER) and block error rate (BLER) [10].
We use the Atoll software to simulate the network coverage predication for Libyana mobile service provider network at a part of the Capital Tripoli, geographical layers were well prepared and used.
Methodology
In this section, we present the geographical data preparation and mobile network dimensioning.
Beside, network parameters including sites and transmitters, Atoll allows users to manage the geographic data for signal analysis and simulation, the following are the main needed geo-data layers:
- Digital train Model: we use DEM with 12.5m resolution, it represents the accurate ground heights and is crucial in determining potential obstructions to the mobile signals.
- Ortho- image: Orthorectified high resolution satellite images use as a visual reference to the study area, the images do not affect the calculations.
- Clutter Classes: describe land cover land use, the classes are taken into account by the propagation model during computations.
- Clutter Heights: The layer describe the altitude over DEM with one altitude value per pixel, the clutter heights are taken into account in some propagation models computations.
- Traffic data Map: It contains information on capacity service use per area, the maps are used for network capacity analysis.
There are other victor maps which are used in Atoll software but it have no effect on the computations including population maps, rainfall maps, road maps.
Geographical data maps
The city of Tripoli is located in the North West of the country, the city is centered at 130 11’ 9’’E longitude and 320 54’ 8’’N latitude, the population of the Tripoli is just above 2 Million.
In this work, we will use only three layers for coverage prediction computations: DEM, clutter classes, and clutter height.
A 12.5m DEM (ALOS PALSAR global Radar) of the Study area were freely downloaded from the link https://search.asf.alaska.edu, fig. (1).
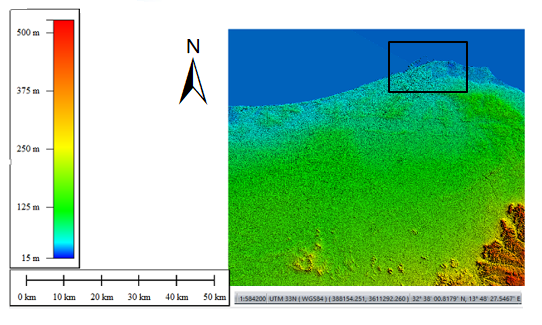
Figure [1]: DEM of the study area the city of Tripoli.
We produced two clutter classes’ layers: Small scale and wide scale layers. For small scale (12.2km2), we have used visual skills and digitizing by ArcGIS 10.6 software to defined the clutter classes from a 50cm resolution Pleiade satellite image as shown in fig. 2.
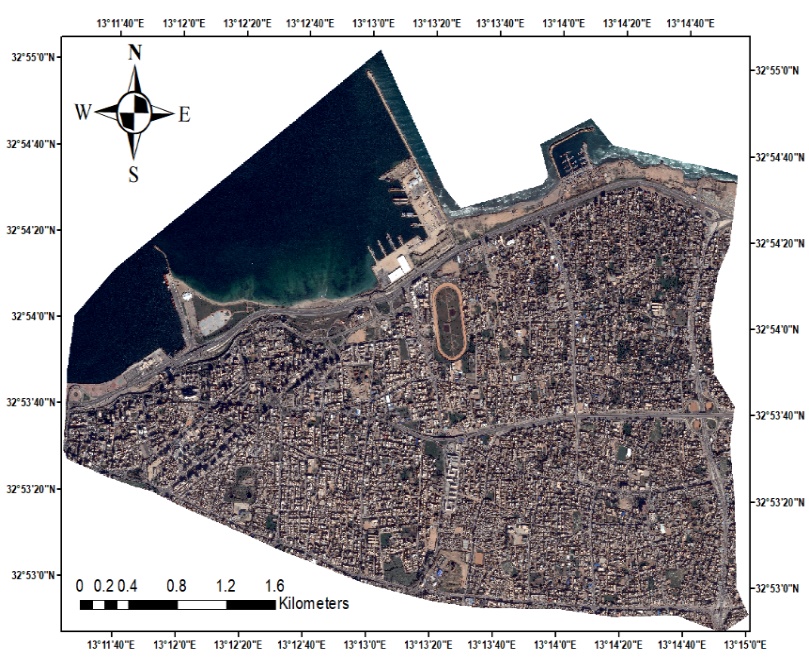
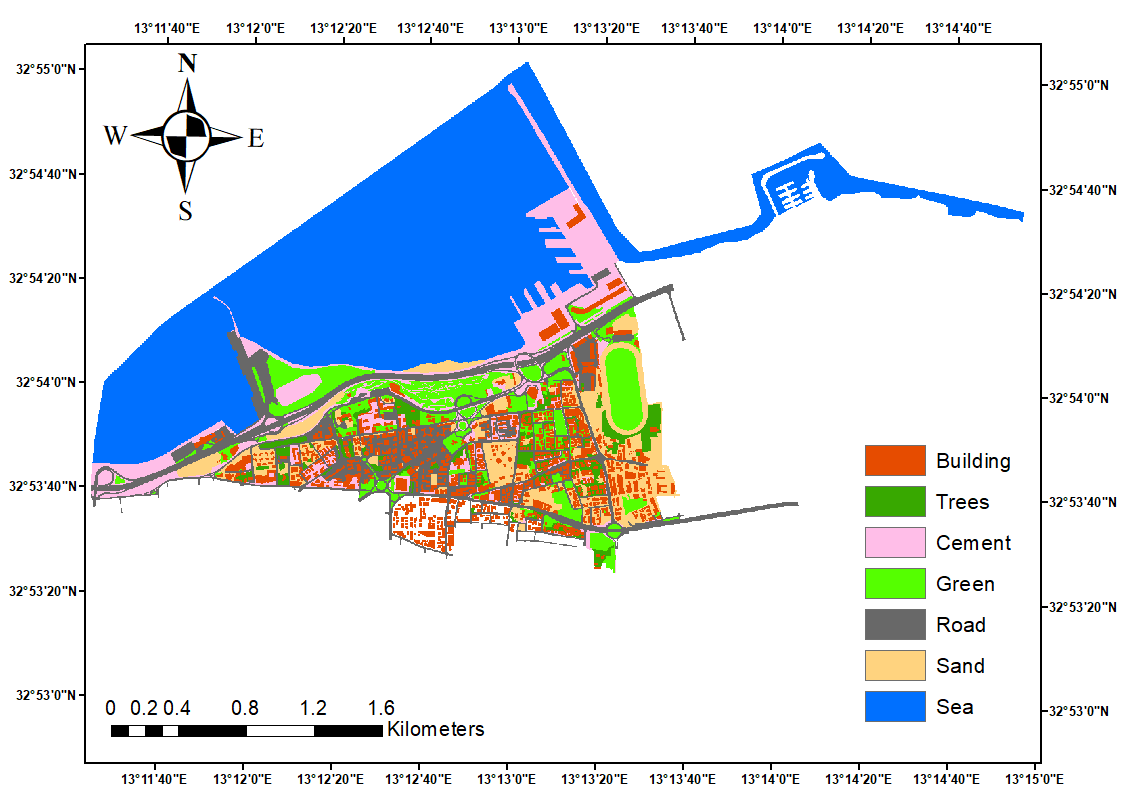
Figure [2]: Plaeide image of Tripoli city center (left) and LULC (right).
For wide scale clutter classes (land use land cover) layer, we have used ERDAS Imagine software to define the clutter classes from a 10m Sentinel 2 satellite imagery, the date of the image was 2021.
Unsupervised classification performed starting with 50 class, the pure classes were recorded, and the mixed classes were extracted by mask and thereafter were reclassified again and so on. The final clutter classes layer were achieved by Overlay function to combine all the resulted classes, the map is shown in figure (3).
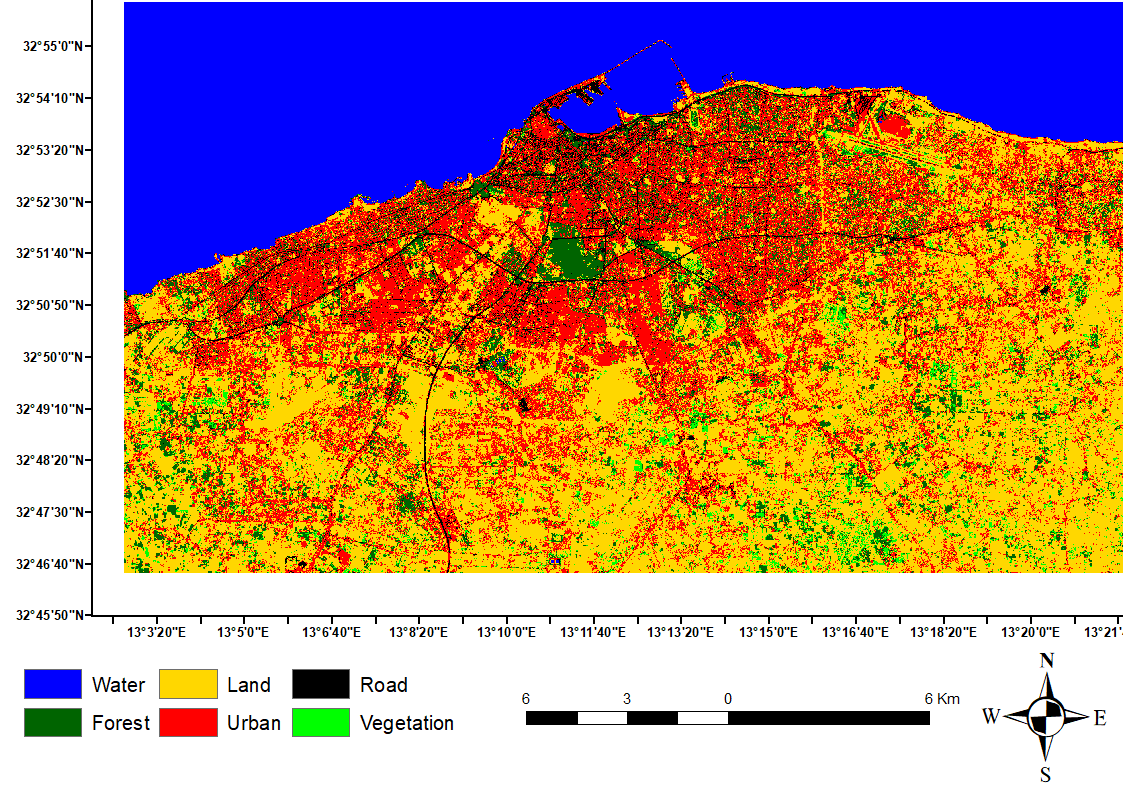
Figure (3): Land use Land cover for Great Tripoli Area.
Each pixel in the image has a single value of class, the final clutter classes in this study were: Water, Land, Road, Forest, Urban, and Vegetation.
The mobile signal strength is interfered by the type of class while it is travelling between the stations and the user’s instruments.
Clutter height layer in fig. 4, was produced by digitizing the building and trees on a 2015, 50cm resolution Pleiade satellite image, the height of the digitized building were added from the attribute table, we visited the area to validate the estimated building heights.
Atoll software uses this layer in some propagation models computations.
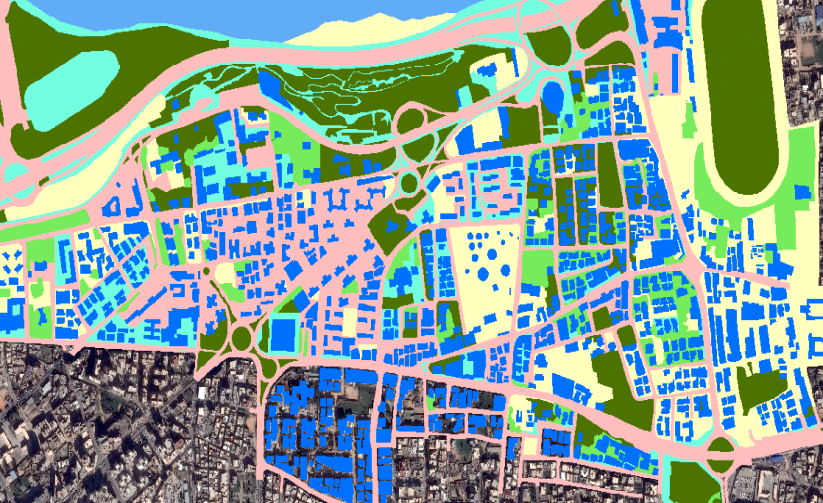
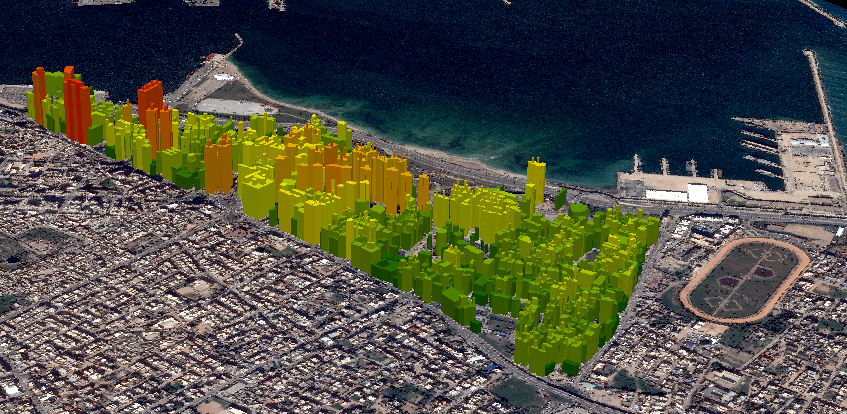
Figure (4): Clutter height layer for the part of Tripoli city.
LTE Mobile Radio Network Planning
LTE Mobile network planning refers to the process of designing a network structure and specifically determining network elements. The processes of network planning and optimizing are becoming more challenging due to the drastic changes of the modern wireless communication technologies, and due to the increasing number of subscribers and expanding their needs.
In general, the plan can be divided into three tasks:
- Link budget calculation.
- Coverage, capacity planning and spectrum efficiency.
- Parameter planning.
The LTE mobile link budget is the sum of all transmitter and receiver component’s gains and losses in the propagation path in downlink or uplink in addition to the impact of the environment through which the RF signal propagate. The link budget calculations estimate the maximum allowable path loss [MAPL] between the user equipment UE and the base station eNodeB, and help in defining the cell ranges along with the coverage thresholds with suitable propagation models [11].
MAPL = EIRP + Rx Gains – Rx losses – Receiver Sensitivity – Total margins [1].
Where,
EIRP = Tx power + Tx antenna gain – sum body loss [2].
And,
Total margins = slow fading margin + Fast fading margin + interference margin + building or vehicle penetration loss.
The parameters of the link budget can be classified into four types: system parameters, transmitter parameters, receiver parameters, and margin reservation.
The system parameters include operating frequency, system bandwidth, and data bite rate.
The transmitter parameters are: Transmitter power, antenna gain, body loss, cable loss, connector loss. The receiver parameters are: UE noise figure, thermal noise power, carrier – to interference ratio (C / I), and the receiver sensitivity.
Receiver sensitivity refers to the minimum signal power that the receiver can decode and interpret, it is given by:
Receiver sensitivity = noise spectral density (dBm / Hz) + Bandwisth (dBHz) + noise figure (db) + (C / I) dm.
Shadow fading indicates the mobile signal fading brought by environment obstruction due to a buildings or natural features. In urban areas, the shadow fading standard deviation is a bout 8 – 10 db, while in suburban and rural areas is 6 -8 db.
Interference margin accounts for the increase in the terminal noise level caused by the interference from other users and it indicates the degradation of the system receive performance.
A typical LTE network link budget parameters is shown in table [1].
Propagation Models describe the average mobile signal propagation, they are used to calculate the maximum cell rage, and the model depends on propagation environment morphology, distance, operating frequency, and indoor / outdoor.
Table 1. Example of LTE radio network parameters
| Parameter | Unit | Urban (Uplink) | Urban (Downlink) | |
| Transmitting End | Tx Power | dBm | 23 | 46 |
| Tx Antenna Gain | dBi | 0 | 18 | |
| Tx Body Loss | dB | 3 | 0 | |
| Tx Feeder Loss | dB | 0 | 1.25 | |
| Cable Loss | dB | 0 | 1.25 | |
| EIRP | dBm | 20 | 62.75 | |
| Receiving End | Rx Antenna Gain | dBi | 18 | 0 |
| Rx Cable Loss | dB | 1.25 | 0 | |
| Rx Body Loss | dB | 0 | 2.5 | |
| Thermal Noise | dBm | -103.8 | -103.8 | |
| Noise Figure | dBm | 4 | 7 | |
| Noise Floor | dBm | -99.8 | -96.8 | |
| SINR | dB | -4.19 | -5.37 | |
| Receiver Sensitivity | dBm | -103.99 | -102.17 | |
| Margins | Area Coverage Probability | % | 95 | 95 |
| Edge Coverage Probability | % | 90 | 90 | |
| Slow Fading standard deviation | dB | 8 | 8 | |
| Slow Fading Margin | dB | 5 | 7 | |
| Interference Fading | dB | 1 | 2 | |
| Indoor Penetration Loss | dB | 3 | 5 | |
| Sum of Margins | dB | 9 | 12 | |
| Maximum Allowed Path Loss MAPL | dB | 131.74 | 162.82 | |
Standard propagation model (SPM), Okumura-Hata model, Cost-Hata model, CCIR model and Young model are the common propagation models which are used in outdoor wireless propagation model in coverage ranges between 1 km and 20 km [12].
The formula of path loss (Cost-Hata model) is shown as following:
Where the correction factor, = 3 dB for urban and 0 dB for suburban and rural.
As the maximum path loss is known, the cell radius can be calculated. Generally, the cell radius of uplink and downlink is not the same and the smaller is taken as the network cell radius.
Once the cell radius is calculated as well as the site coverage area for one sector site and three sector site, the required sites number at a certain geographical area can be defined.
Results and discussion
Atoll working environment is very flexible, there are different propagation models suited for certain conditions are available in Atoll for path loss calculation.
LTE coverage predictions in Atoll allows to analyse the effective signal levels and quality, and in order to carry out the different computations (path loss, coverage, signal level, overlay… etc). Three geographic data types are imported to Atoll: Digital Elevation Model (DEM), clutter classes, and clutter heights.
LTE Libyana Mobile network equipment and data including sites, transmitters, and antenna parameters are all imported to Atoll for computations.
Figure (5) shows coverage by transmitter computation for SPM model. When this model is used, Atoll is taken into account the clutter heights map and the signal level decreased drastically.
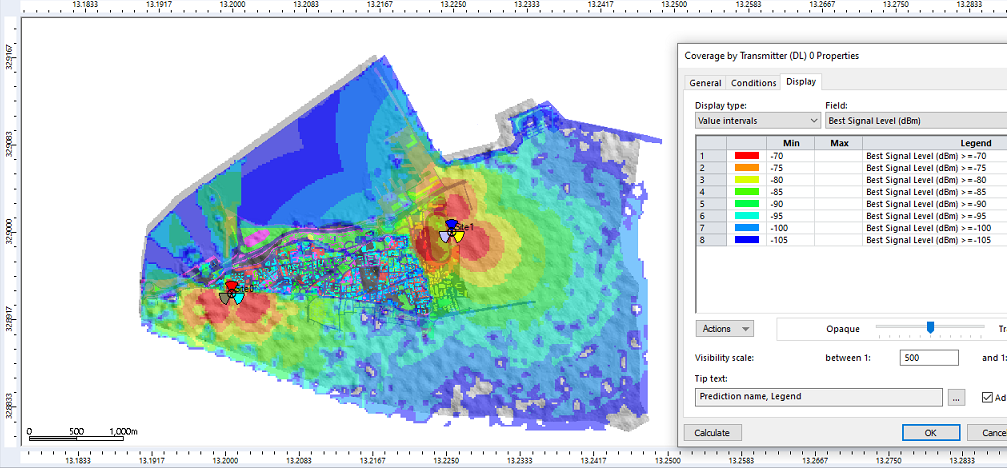
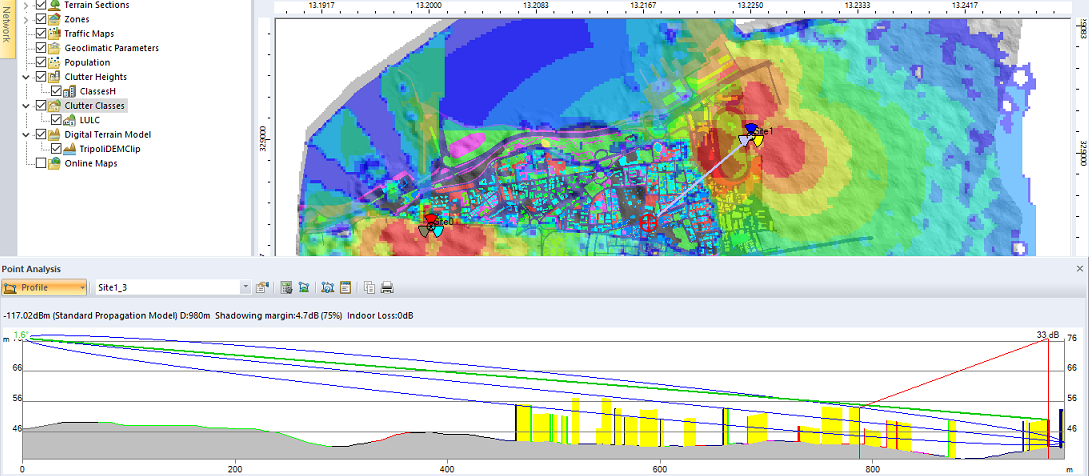
Fig. [5]: Coverage by transmitter (Top), Point analysis with SPM model (bottom).
The following simulations (fig. 6) are made on (45) sites from Libyana company. Cost-Hata model was used, operating frequency is 2,100 MHz. The standard coverage predictions including prediction by transmitter, by signal level, and by overlapping zones were computed. The prediction profile between any point at the map and the surrounding transmitters was analyized by point analysis tool.
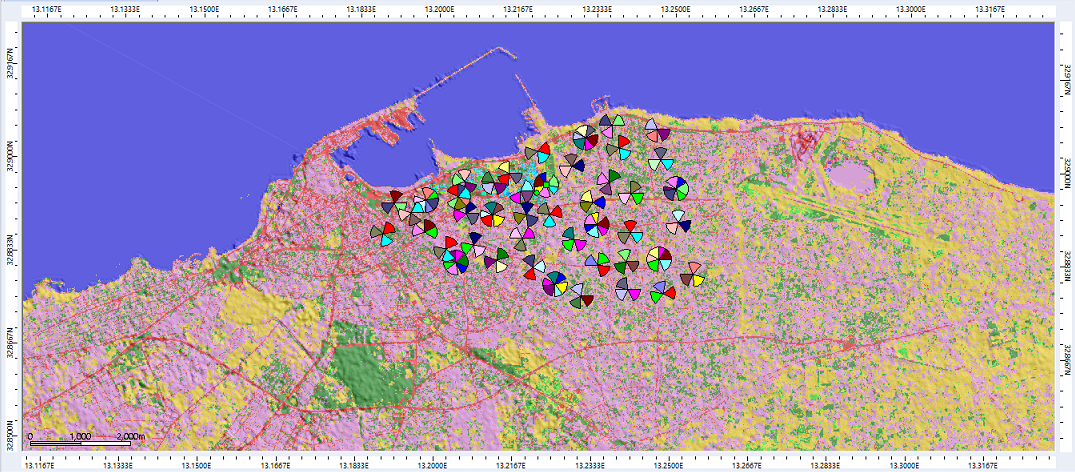
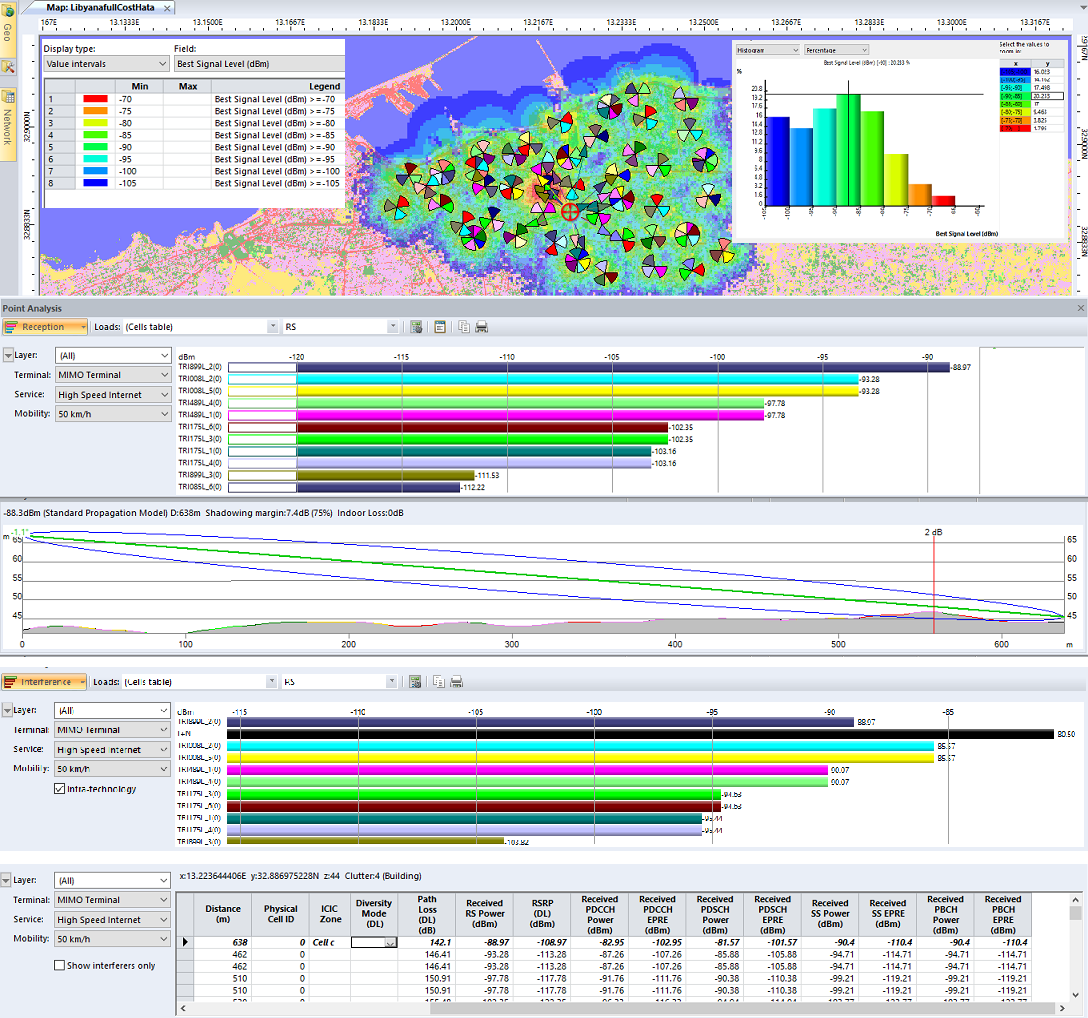
Fig. 6: LTE Libyana Mobile Network and coverage by transmitter analysis.
The prediction coverage by transmitter has shown that all areas are well covered, there are only small sports where the signal strength went law to -95 to -100 dB (Blue color), and the statics of the coverage areas percentage of each signal level are also shown, signals with level between -85 dB to -90 dB have covered above 20% of the study area. The reference signal (RS) from multi-transmitters were analysed, the reception signals are shown and their levels refer to their distance from the selected point on the geographical map.
Figure (7) shows the prediction coverage by overlapping zone. Overlapping zones are composed of pixels that are covered by more than one transmitter, for instance, “Number of servers >=2” represents the region where the received signal level from different transmitters have a difference less than 4dB as defined in properties box of the analysis.
This coverage prediction may be used to help evaluate adequate coverage and determine if there are many interferers of the designed network.
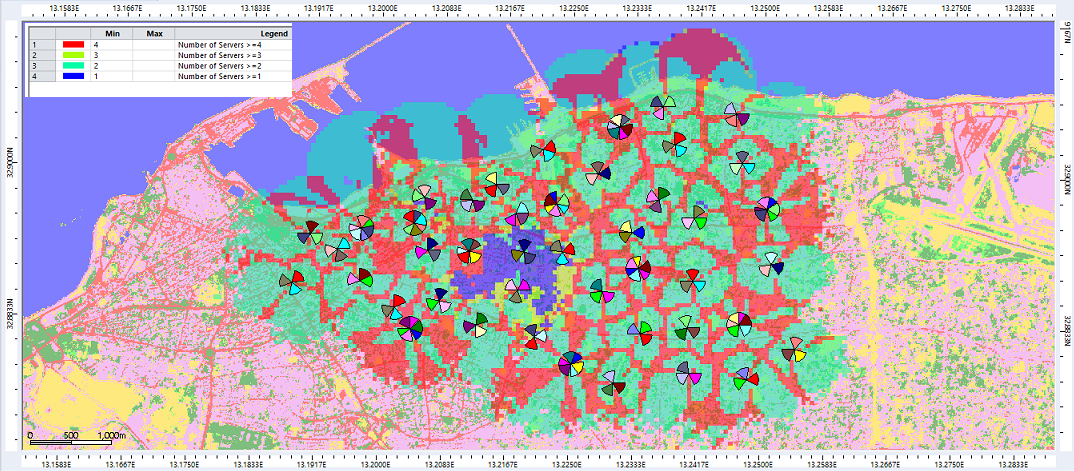
Fig. 7: Prediction by overlapping zones.
Conclusion
Coverage predictions and analysis processes by Atoll provide powerful tools for mobile system designers. As the signal propagates on geographical map’s pixels between transmitters and receivers, it is interfered by the type of the clutters which defined by those pixels, the path loss matrices calculations are carried out using propagation models and other calculations such as diffraction and shadow fading. Ultimately, precise clutter data and maps are needed for better computations and optimum results. Remote sensing and GIS can highly contribute in creating geographical maps as well as DEM, and contribute in creating other vector maps including population, traffic and rain maps, these geospatial data are taken into account by the propagation models during computations. The more accurate of these maps, the better simulation results by the mobile network design software.
Acknowledgment
The Authors would like to thank the Libyana mobile company for providing us with some network data. We also would like to than Prof. Hlal Etboli for his advices and supports.
Referecnes
[1] A. Alkasih, E, Abdullah, A. Torkman, “The contribution of geospatial technologies in achieving of sustainable development goals”, first Maghreb International Conference on: The sustainable Development Updates “Reality and Hope”, Tunis, March 2021, PP. 256 – 267.
[2] Warvin Hussein FATTAH; Mehmet Ishak YUCE,2015, ‘Hydrological Analysis of Murat River Basin’, International Journal of Applied science and technology, vol. 5, no. 5, pp. 47-55.
[3] E Abdullah and A. Alkasih, “The Morphological and watershed analysis of Wdi Almajanin using Remote Sensing and GIS techniques”, Journal of Science and Space Technologies, No. 5 Secember 2019, ISSN: 2490-4244, PP. 91 -105.
[4] LTE Book, wce2014, PP 705-709.
[5] Book: Atoll Wireless Network Engineering Software: Technical Reference Guide for Radio Networks, V. 3.3.
[6] Reshma Begum Shaik, T.Krishna Chaitanya, “Simulation of GSM Mobile Networks Planning Using ATOLL Planning Tool”, International Journal of Engineering and Innovative Technology (IJEIT), 2012.
[7] A. Benjamin Paul & Sk.M. Subani,”Code Planning of 3G UMTS Mobile Networks using ATOLL Planning Tool”, International Journal of Engineering Research & Technology (IJERT) , 2012
[8] Raphaël Nlend, Emmanuel Tonye, “Planning and simulation of LTE radio network: case of the city of Yaoundé”, IOSR Journal of Electronics and Communication Engineering (IOSR-JECE) e-ISSN: 2278-2834,p- ISSN: 2278-8735.Volume 14, Issue 2, Ser. I (Mar.-Apr. 2019), PP 19-29.
[9] Amevi Acakpovi, Ibrahim Tahirou, Mymy Christian Gnahore and Francois Xavier Fifatin, “Dimensioning Tool for 3GPP Long Term Evolution (LTE) Radio Access Network”, International Journal of Mobile Communication & Networking, ISSN 2231-1203 Volume 5, Number 1 (2014), pp. 15-28.
[10] I. elfeghi, Z. Zubi, A. jamil, H. Algabroun, “Long Term Evolution Network Planning and Performance Measurement”, conference paper 2013. Recent Advances in Image, Audio and Signal Processing.
[11] Noman Shabbir, Muhammad T. Sadiq, Hasnain Kashif and Rizwan Ullah, “Comparison of radio propagation models for long term evolution (LTE) network,” International Journal of Next-Generation Networks (IJNGN), 2011, Vol.3, No.3.
[12] Book: Atoll Radio Planning & Optimisation Software, User Manual Radio, V. 3.1.0.
