ABDULAZIZ AHMED MOHAMMED1
Lecturer at the Higher Institute of Science and Technology Sirte HIST-S. Libya.
Email: zezoabojdeda@gmail.com
HNSJ, 2023, 4(2); https://doi.org/10.53796/hnsj4250
Published at 01/02/2023 Accepted at 21/01/2023
Abstract
This project explored the effect of steel wire of diameter 1.5mm prestressed to 400 MPa in concrete prism of 50 MPa characteristic strength , five pieces of steel wires of diameter 1.5mm were tested for tensile strength, The ultimate tensile strength was 800 MPa. A steel mould was designed and made with provision for prestressing simultaneously 4 pieces of steel wire. A total of 6 partial prestressed prism (PPP) were cast and moistcured for 28 days before testing for flexural strength,The flexural strenght tests showed that the first crack occurred at around 10 KN,The PPP of self-weight 0.25 KN/m has potential to be used in the installation of a test frame for dynamic loads experiments,The cracked PPP can also be used for the study of structural rehabilitation with carbon fibre reinforced polymer (CFRP).
Key Words: Partially prestressed, Stress-Strain ,Deflection behavior
INTRODUCTION
Partially prestressed concrete, therefore, occupies the complete spectrum between the two extremes. The conventional reinforced concrete in which none of the reinforcement is prestressed represents one extreme while the other extreme, commonly known as “fully prestressed” concrete, consists of reinforcement all of which is prestressed.
Decades have gone by since the development of prestressed concrete by Freyssinet More and more partially prestressed concrete structures have been built. Today partial prestressing is accepted world wide, at least implicitly, in most of the engineering codes of practice and a number of prominent researchers have already drawn attention to its potential. (Lee.k .h, July, 1984)
Problem statement
Traditional method of cast-in-situ concrete construction normally requires the use of bulk handling equipment. The production of partial prestressed prism (PPP) of weight not exceeding 0.25 kN/m with moment of resistance not less than 2 kNm are the challenging targets. The limitations of weight and strength require the use of smaller steel and concrete sizes. As very limited knowledge is available on such area, this study experimented with small steel wires of diameter 1.5mm in small concrete prism of 100mm×100mm cross section. The effect of prestressing on the flexural strength of PPP is the focus of study.
Objectives
The objectives as follows:
(i) Study the stress-strain characteristics of prestressing wire.
(ii) Study the load deflection behaviour of partial prestressed concrete prism.
Limitation of Work
For these researches that will facing a limitation of the work is the tested sample which is mould of the sample is not provided in University Tun Hussein Onn Malaysia, UTHM. So that it could not use the wood formwork because the wood will absorb the water contain inside the concrete and we can not pre-tension the wire, it will affected the result. To solve this, have to modified a steel mould to cast the concrete. Another limitation of work which is the cube mould is limited provide in the laboratory.
Previous studies
Types of Prestressing
Full limited or partial prestressing Based on the amount of prestressing force, three pes of pressing are defined.
1-Full Prestressing:- When the level of prestressing is such that no tensile stress is allowed in concrete under service loads, it is called Full Prestressing.
2-Limited Prestressing- When the level of prestressing is such that the tensile stress under service loads is within the cracking stress of concrete, it is called Limited Prestressing.
3-Partial Prestressing- When the level of prestressing is such that under tensile stresses due to service loads, the crack width is within the allowable limit, it is called Partial Prestressing (Magnel, G.,1998) (Nawy, E. G, 2006.).
Stages of Pre-tensioning
In pre-tensioning system, the high-strength steel tendons are pulled between two end abutments (also called bulkheads) prior to the casting of concrete. The abutments are fixed at the ends of a prestressing bed. Once the concrete attains the desired strength for prestressing, the tendons are cut loose from the abutments.
The prestress is transferred to the concrete from the tendons, due to the bond between them. During the transfer of prestress, the member undergoes elastic shortening. If the tendons are located eccentrically, the member is likely to bend and deflect (camber), the various stages of the pre-tensioning operation are summarized as follows.
1) Anchoring of tendons against the end abutments
2) Placing of jacks
3) Applying tension to the tendons
4) Casting of concrete
5) Cutting of the tendons.
During the cutting of the tendons, the prestress is transferred to the concrete with elastic shortening and camber of the member. The stages are shown schematically in the following figures. (Collins, M. P. and Mitchell, 1991).
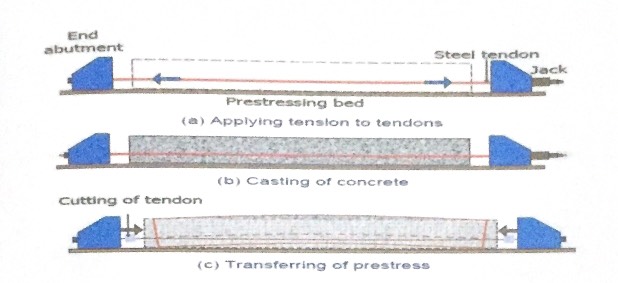
Figure 1 stages of pre-tensioning
Stiffness of Prestressing Steel
The stiffness of prestressing steel is given by the initial modulus of elasticity. The modulus of elasticity depends on the form of prestressing steel (wires or strands or bars).IS:1343 – 1980 provides the following guidelines which can be used in absence of test data.
Table 1: Modulus of elasticity (IS: 1343-1980)
| Type of steel | Modulus of elasticity |
| Cold-drawn wires | 210 KN/mm^2 |
| High tensile steel bars | 200 KN/mm^2 |
| Strands | 195 KN/mm^2 |
The minimum tensile strengths for different types of wires as specified by the codes are reproduced. (Dr. Amlan K Sengupta and Prof. Devdas Menon, October 2008).
Table 2: Cold Drawn Stress-Relieved Wires (IS: 1785 Part 1)
| Nominal Diameter (mm) | 2.5 | 3 | 4 | 5 | 7 | 8 |
| Minimum Tensile strength 2010 (N/mm^2) | 2010 | 1865 | 1715 | 1570 | 1470 | 1375 |
The proof stress (defined later) should not be less than 85% of the specified tensile strength.
Load and deflection behavior.
The deflection of a member is calculated at least for two cases.
1) Short term deflection at transfer.
2) Long term deflection under service loads.
The short term deflection at transfer is due to the prestressing force (before long term losses) and self-weight. The effect of creep and shrinkage of concrete are not considered.
The long term deflection under service loads is due to the effective prestressing force (after long term losses) and the gravity loads. The permanent components of the gravity loads are considered in the effect of creep.
These components are dead load and sustained live load. [Lee.k.h, July, 1984]
Previous researcher study on Load and deflection behavior of Partially Prestressed Concrete Beams.
partially prestressing is considered an intermediate design between the two extremes. So, combining high strength concrete with partial prestressing will result in a considerable development in the use of prestressed concrete structures regarding the economical and durability view points. This study presents the results of seven partially prestressed high strength concrete beams in flexure.
The tested beams are used to investigate the influence of concrete compressive strength, prestressing steel ratio and flange width on the behavior of partially prestressed beams. The experimentally observed behaviors of all beams were presented in terms of the cracking load, ultimate load, deflection, cracking behavior and failure modes.
It was noticed that the load-deflection response of all the tested beams acted linearly during the loading and un loading of the first two cycles prior cracking, while it appeared in a parabolic manner after cracking which might be encountered due to the non-linear behavior of the stress-strain behavior of the prestressing strands.
Figure 2.14 Load-deflection behavior for the tested beams under several studied parameters; (a) Beam with different concrete compressive strength; (b) Beam with different prestressing steel ratio; (c) Beam with different compres- sion flange width. (Shady H. Salem, Khalid M. Hilal, July 2013).
Previous researcher study on Load and deflection behavior
The beam was prestressed with two prestressing steel strands to 202 kN. The concrete was designed to have a 28-day compressive strength of 40 MPa.
The load-deflection response of the beam for this study obtained via lab tests, the vertical deflections at the mid-point of the Original Beam (the right-most end of the graphs) were extracted for varying levels of applied load. These are summarized in Table 2.1 and then plotted in Figure 2.15.(Ray Saiedi, December 2007)
Table 3: Load vs. Deflection from Model
| Load (kN) | Deflection (mm) |
| 0 | 0 |
| 10 | 0.82 |
| 20 | 1.64 |
| 30 | 2.46 |
Results from Tests:
Figure 2.16 reproduces only the curve corresponding to the beam pretensioned using steel strands and includes data labels for measured points.
Model vs. Tests
Figure 2.17 plots the load deflection curves from the model and the lab tests together in one graph. Note that the curve associated with lab tests was only drawn up to the point of yielding. A comparison of the two curves reveals a close match between the two. Table 2.2 lists the percentage of error for each load case.
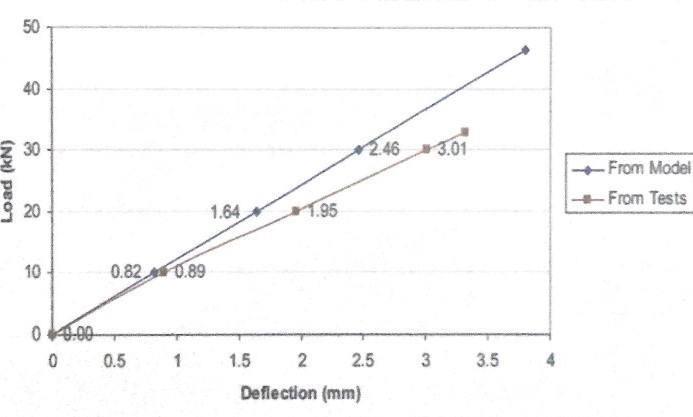
Figure 2 Load vs. Deflection from model and tests
Table 4: Load vs. Deflection from model and tests
| Load(KN) | Deflection (mm) | ||
| From Model | From Tests | Error (%) | |
| 10 | 0.82 | 0.89 | 9 |
| 20 | 1.64 | 1.95 | 19 |
| 30 | 2.46 | 3.01 | 22 |
Conclusion
As a conclusion for these chapter 2, is to do a literature review for the previous researcher of research in a different perspective on the small part relate to these prestressed concrete and partial prestressed concrete prism From the previous research,We will use the frame work for casting concrete, such as shown in figure 2.13, we will Explain the steps to prepare the samples and Curing for 28 days and tested.
Methodology
Specimen Designation
The experimental study consists of fabricating and testing a total of six partial prestressed concrete prism with total span length of 1000mm and square section of 100x100mm in the Structural Engineering Laboratory, Universiti Tun Hussein Onn Malaysia.
Every beam reinforcement by four wires, two in the top side and two on the bottom side, located at a distance of 20 cm from the outer surfaces and the distance between the wires 60 cm as shown in the figure below.
We have six samples of each sample four-wire we performed process pretensioners for the wire in each prism a value of 700.4 N.
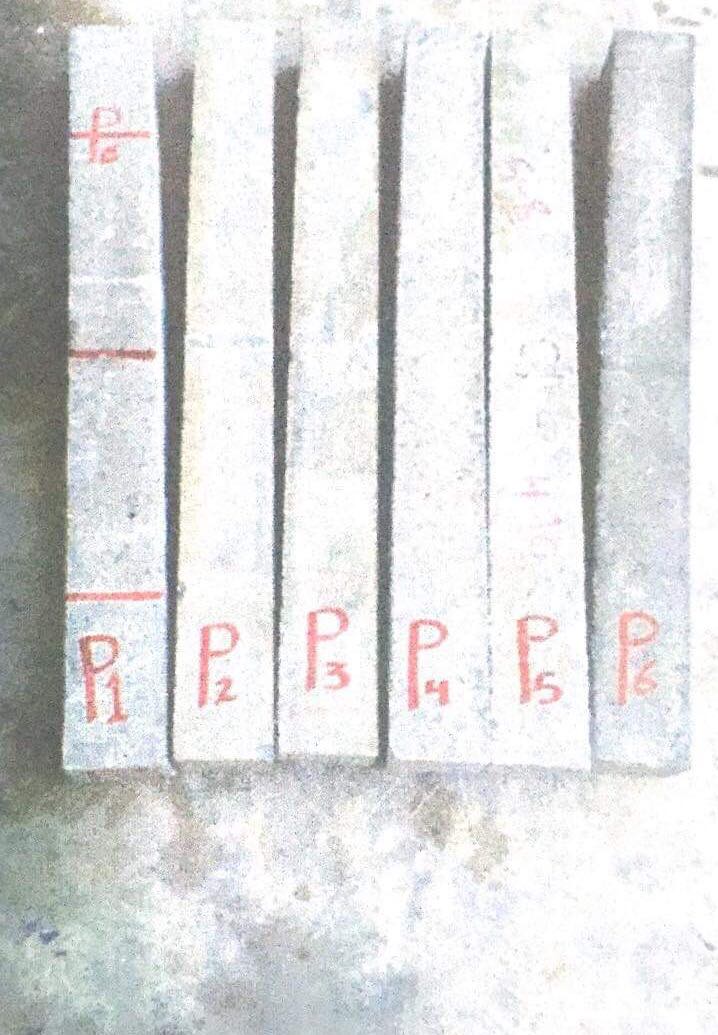
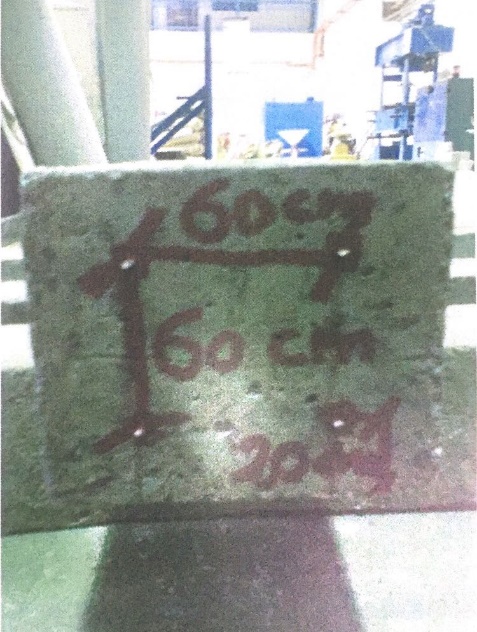
Figure 3 specimen Designation
Specimen Preparation and Fabrication
Process of specimen preparation the following order:-
Is equipped framework and repainted it with oil and framework closed well In order to get a regular shape as shown below, The four wires that represent reinforcing beam is passed through the holes in framework allocated to them in terms of the end be constrained by a node, The other side of the wire Closed tightly by a small screw located on the outer side of the steel slide Moving by two Large screw As shown in the figure 5 below.
Prestressing wire Preparation
The process of Tension wire manually by framework the designer for this purpose. After placing the four wires in place allocated to them are fastened tightly to the end of the outer side of the slide steel sliding, then measure the distance between the ends of the frame still and moving by vernier caliper and record the distance, and then we pulled the wire by two large screw as shown in Figure 5, from time to time measure the distance between the ends of the frame still and moving by Vernier caliper, by process of subtraction we get the increase in length,divide the increase in length to the original length to get the strain as show Table 5, After obtaining strain we use curves the stress and strain for the wire, and we can obtained on the stress corresponding to the strain by curves as show Figure 7, We have known the stress is equal to force divided by area of the section, and the sectional area of the wire is equal to (1.76 mm ^ 2) and thus we got the tensile strength of each wire in prism, and shapes below shows the details of that.
We have six samples of each sample four-wire we performed process pretensioners for the wire in each prism a value of 633.6 N.
We will explain it in the next steps:-
Table 5: Calculate strain
| The first distance | 50 mm |
| Distance after the tensile | 52 mm |
| The increase in length | 2mm |
| Strain | 2/1050 = 0.0019% |
Formwork
Fresh concrete requires some kind of formwork to mould it to the required shape. Moreover, we need to formwork strong so that we can tensing wires for our samples, as well as the need to formwork it is moving parts, Therefore , we designed two formwork of steel in a metal workshop has a weight 41.5 Kg and has a total length 1.46 m the segment devoted casting prism has a length 1000 mm, is located between the internal movable two barriers, as shown in Fig 4, It has two screw in the end passes through the slice steel with four holes 60 cm distance between them, as is required in the design by the screw and snail moving steel slide back and forth as needed.
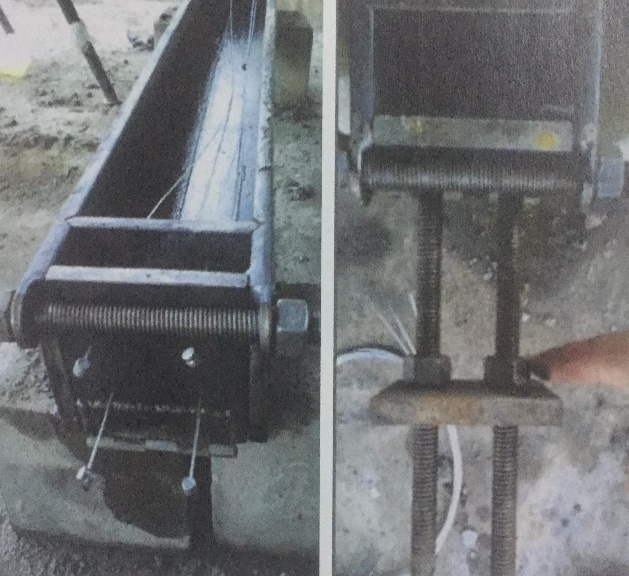
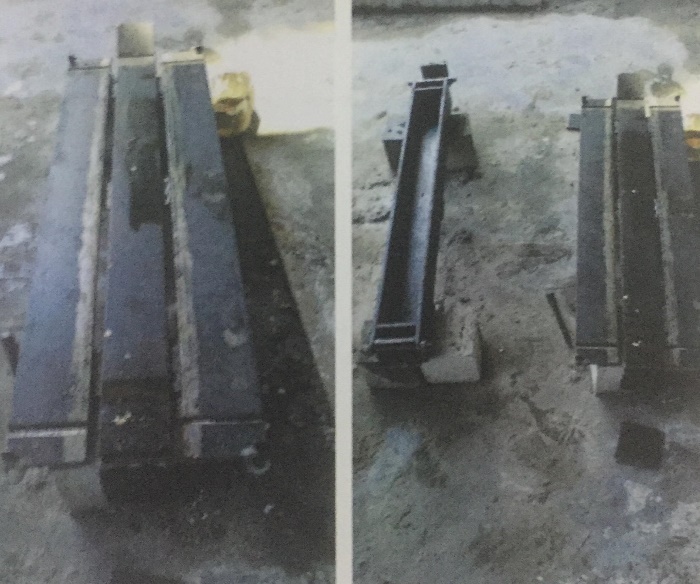
Figure 4 Both sides framework
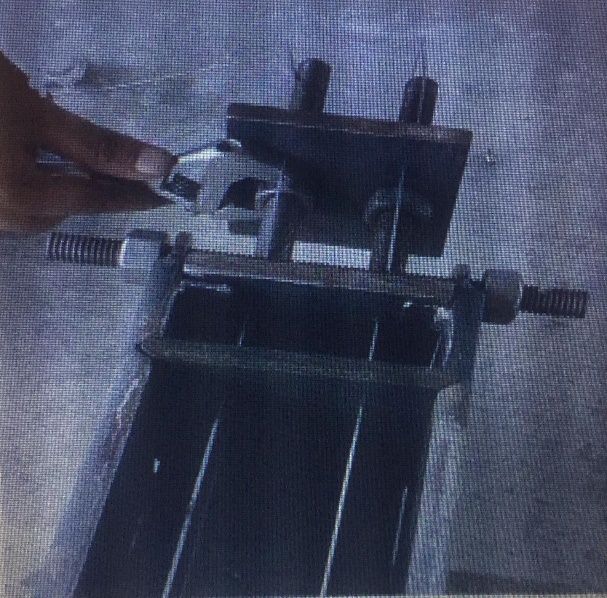
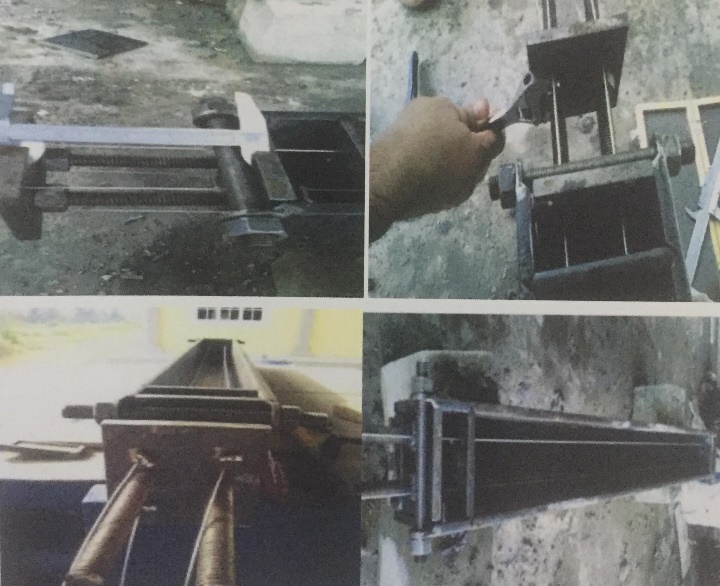
Figure 5 prestressing wire preparation
Casting of Specimens
Figure 5 shows the process of casting the prism where ready mix concrete was poured into the formwork and the top surface of all specimens was leveled by using trowel to obtain a smooth surface.
During casting samples we are casting two concrete cubes 150*150* 150 mm each time. To get in the end the total number of 6 prism and 6 cubes.
Curing of Concrete
The concrete is cured to prevent or replenish the loss of water which essential for the process of hydration and hence for hardening. All curing prevents the exposure of concrete to a hot atmosphere and to drying winds which may lead to quick drying out of moisture in the concrete. Curing is done by spraying water and by spending wet hessian sacks over the surface of concrete as shown in Figure 5.
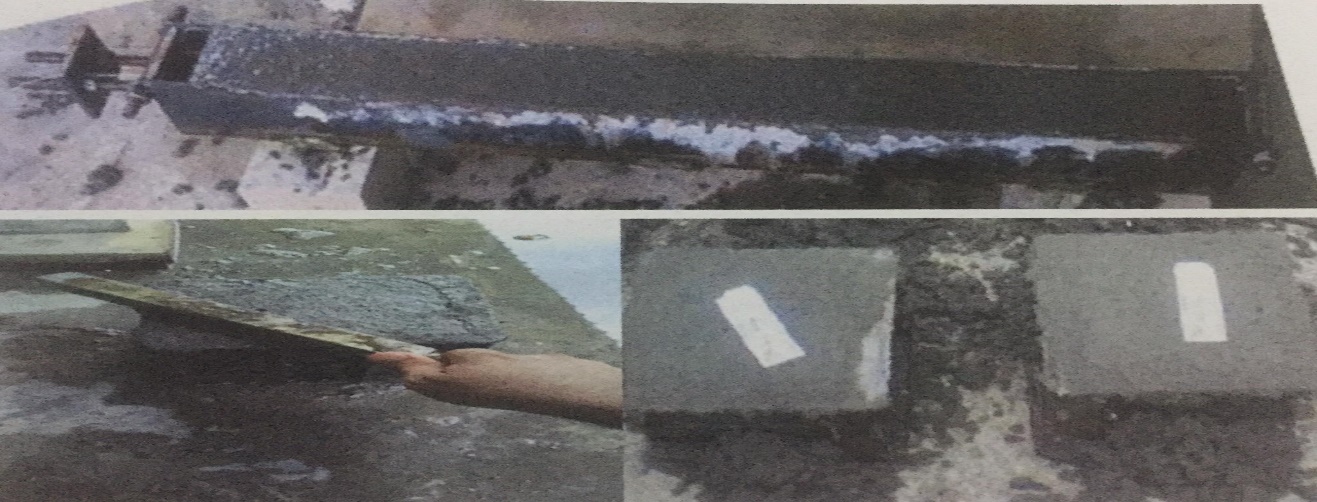
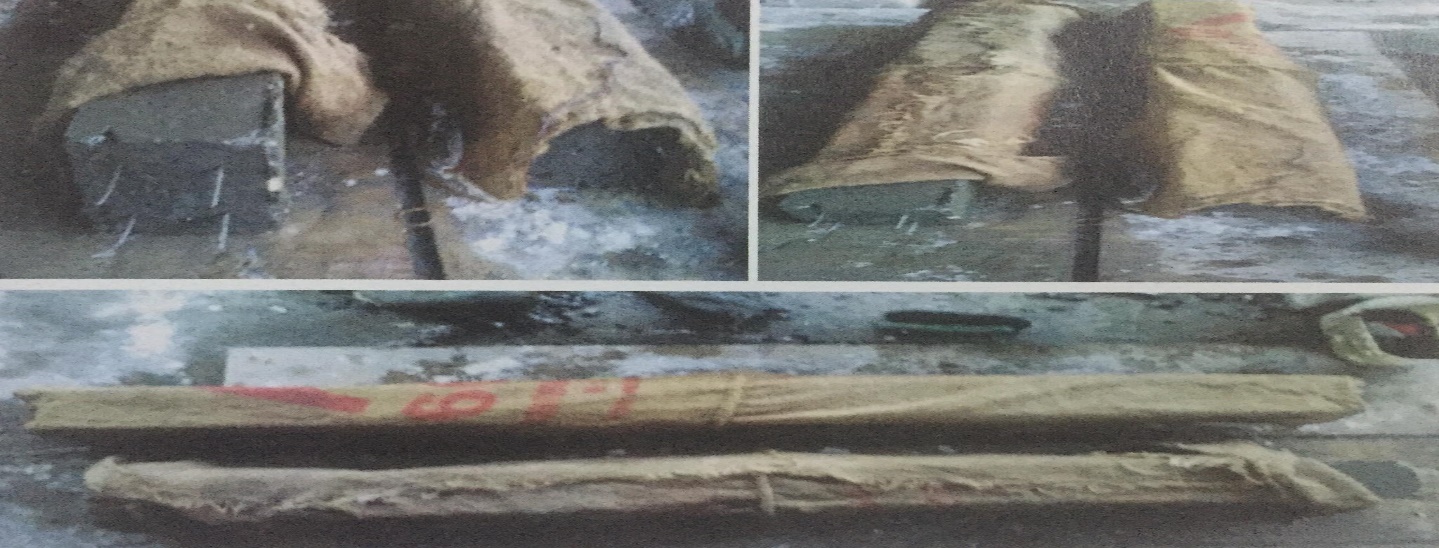
Figure 5 Casting of specimens and curing concrete
Materials Properties
Concrete
The specimens were cast in three batches where two prism were cast in each batch. All batches were made of ready mix concrete with compressive strength of 60 N/mm2. Each batch had a set of two test cubes 150x150x150 mm prepared for compression test, three cubes after seven day and three cubes after Twenty-eight day.
Reinforcement
We have performed Reinforcement samples by p.p.wire so we need to know some of the characteristics of p.p.wire and described in the table below :-
Table 6: characteristics of p.p.wire
| Sectional area of the wire | 1.76 mm2 |
| Youngs Modulus | 9132 (N/mm2) |
| Force @ Break | 1465.2 (N) |
| Wire diameter | 1.5 mm |
| Total length | 1200 mm |
| Actual length in the prism | 1000 mm |
| Strain @ Break | 53.22 (%) |
| Stress @ Break | 651.22 (N/mm2) |
| Full size of the Steel in the prism | 7040 mm^3 |
| Length for the purpose of the process of tensioning | 200 mm |
Stress-strain relationship for p.p.wire.
The coming study describes the stress and strain in five p.p.wire reinforcement of prism were tested under uniaxial tension using Universal Testing Machine (UTM) to determine the ultimate stress, ultimate strain and elastic modulus. properties of steel reinforcement are given in result.
load Gauge and deflection
In concrete Laboratory at the University of Tun Hussein onn Malaysia have applied load on the prism during the application of load we calculated deflection, until we get to the point of failure Beam.we got the Graph shows the relationship between the load and deflection, figure below show the steps of the test, We have installed the steel a slide in the center of the prism to calculate the deflection resulting by LVDT from the application of the load on the beam As shown above, We put the prism on the device and the support is on distance 35 cm from the right and north center-prism As shown in Figure 6.
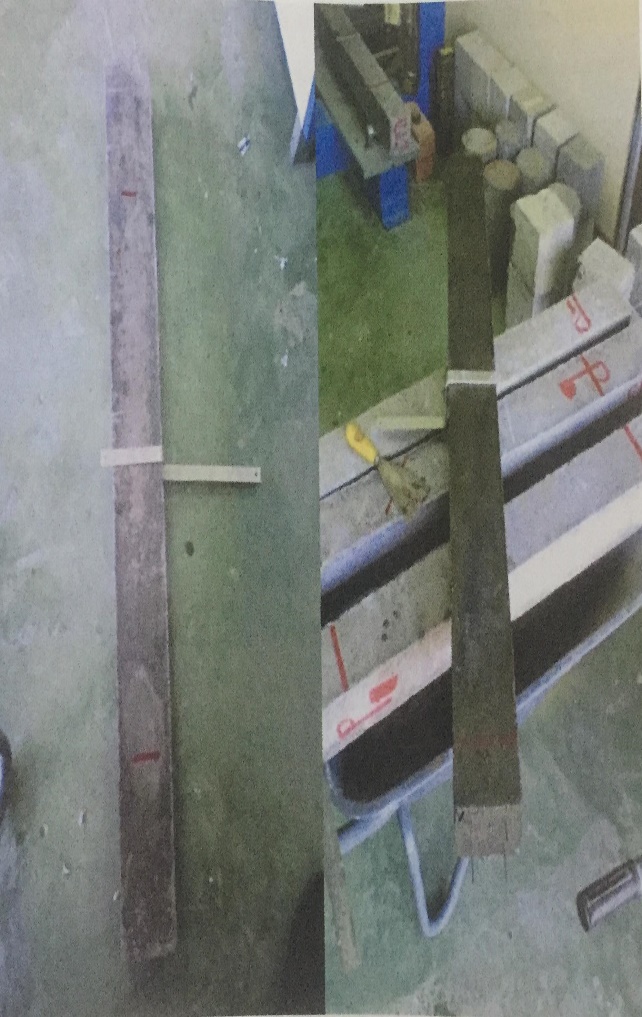
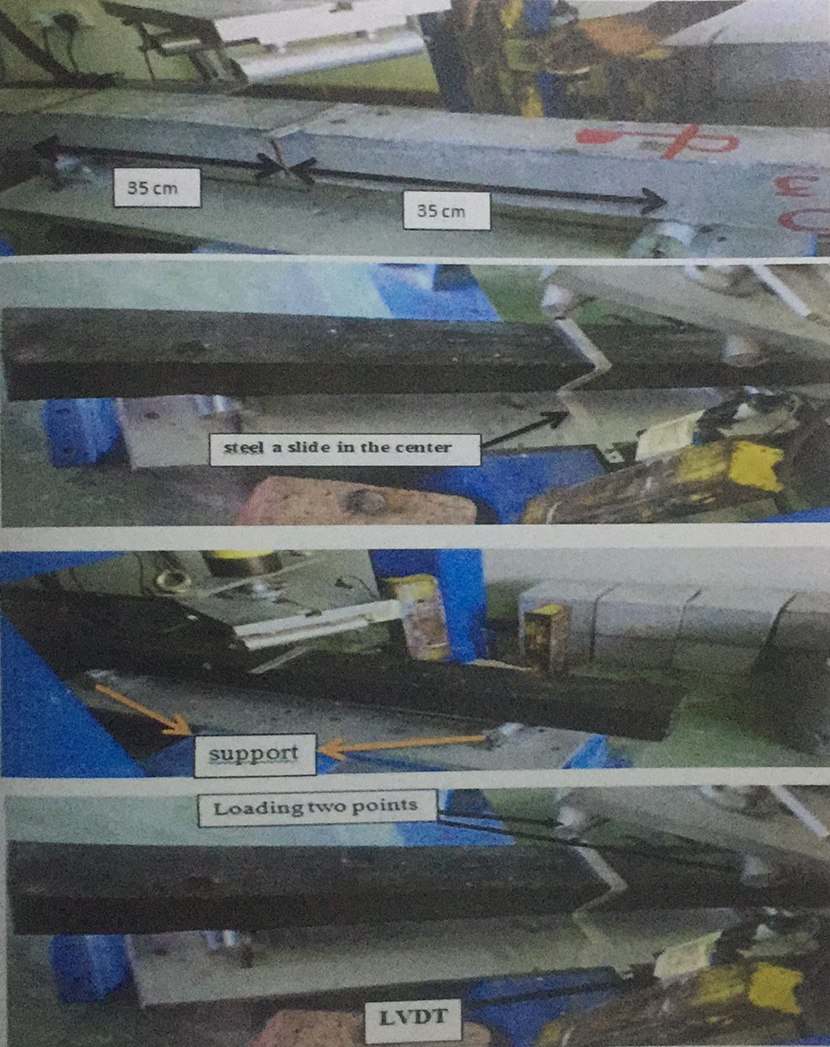
Figure 6 Steel a slide in the center of the prism to calculate the deflection during the test
RESULT AND ANALYSIS
Tensile Test of Wire
The tensile strength for the wire are important to understand the wire can resist how much tension load. From the tension force we obtain the stress-strain graph.we did a test of p.p.wire and also the study of some characteristics using Universal Testing Machine (UTM) in the laboratory Faculty of Mechanical Engineering, Below we show the results of five samples.
Table 7: Experimental results for p.p.wire
| Test
No |
Youngs Modulus @(N/mm2) | Strain@ Peak(%) | Strain @
Break(%) |
Stress @Peak (N/mm2) | Stress @Break
(N/mm2) |
Elong. @ Peak(mm) | Elong. @ Break(mm) | Force@ Peak(N) | Force @ Break(N) |
| 1 | 7569 | 49.475 | 49.61 | 620.00 | 546.67 | 9.8950 | 9.922 | 1395.0 | 1230.0 |
| 2 | 8486 | 14.560 | 139.68 | 606.67 | 520.44 | 2.9120 | 27.936 | 1365.0 | 1208.0 |
| 3 | 10684 | 13.980 | 16.19 | 852.89 | 732.89 | 2.7960 | 3.238 | 1919.0 | 1649.0 |
| 4 | 9173 | 23.590 | 40.12 | 941.33 | 816.89 | 4.7180 | 8.024 | 2118.0 | 1838.0 |
| 5 | 9750 | 17.915 | 20.49 | 885.33 | 508.44 | 3.5830 | 4.097 | 1992.0 | 1144.0 |
| Min | 7569 | 13.980 | 16.19 | 606.67 | 508.44 | 2.7960 | 3.238 | 1365.0 | 1144.0 |
| Mean | 9132 | 23.904 | 53.22 | 781.24 | 651.22 | 4.7808 | 10.64 | 1757.8 | 1465.2 |
| Max | 10684 | 49.475 | 139.68 | 941.33 | 816.89 | 9.8950 | 27.936 | 2118.0 | 1838.0 |
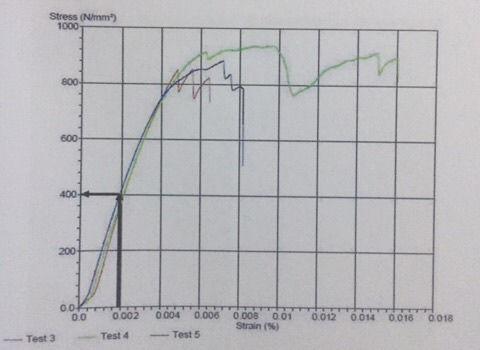
Figure 7 Relationship between stress and strain for p.p.wire
From the several test of the tensile wire is to obtain the mean of the tensile strength of the wire. From the test obtain the mean stress break was about 651.22 MPa and average force break was about 1465.2 N and average Youngs Modulus was about 9132 N/mm2.
Compressive Strength Test
For the compressive strength test of 100mm x 100mm were tested on the 7 days and 28 days. The compressive strength for the concrete were tested under the compressive strength machine and the result were recorded by the computer and the data will print out for analysis used. The data was analyzed and plotted the compressive strength over the curing days.
Table 8: The Compressive strength Test
| DAY | Weight (g) | Compressive strength (N/mm^2) | Average |
| 7 day | 8100.0 | 40.7 | 40.4 |
| 8340.0 | 40.2 | ||
| 8220.0 | 40.3 | ||
| 28 day | 8280.0 | 50.9 | 50.86 |
| 8340.0 | 50.4 | ||
| 8306.0 | 51.3 |
The total concrete cube were to test was 6 cubes. Therefore the 3 cubes were tested for 7 days and another 3 cubes were tested for 28 days. The result were recorded and take the average strength as the accuracy purpose, From the Table 8 it obviously show that the compressive strength are increasing from 7 days to 28 days. The 28days concrete cube will have highest compressive strength compare to 7days, which is 50.86 N/mm^2 and 40.4 N/mm^2 respectively, From the table 8 show that is increasing from 40.4 N/mm^2 to 50.86 N/mm^2, it increase about 10.46 N/mm^2 and 25.5%. Due to under the moisture curing so it will achieved not that high, but it compressive strength consider acceptable. The strength on concrete grade 60 can even more high than these.
Deflection behavior of partial prestressed concrete prism.
Sample Pl

Figure 8 Load-deflection of sample P1
While the load are keep on adding on the beam it show the deflection are getting increase also. When the LVDT show the deflection reach almost 0.8 mm the but it did not show any crack sign on the beam and it continue increase the deflection until the maximum. This is because the manufacture sample using different grade of the concrete it may resist the load more. The failure mode or the maximum load reached to it fail is 7 KN which the deflection is at the 1.39mm.
Sample P2
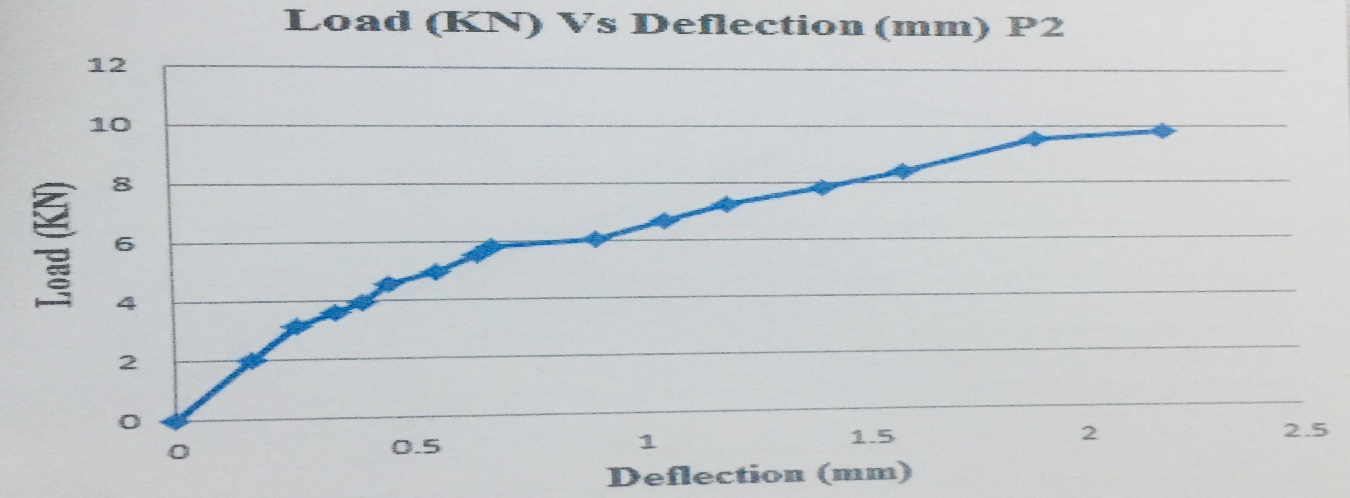 Figure 9 Load-deflection of sample P2
From the Graph obtain the result that is a different with sample P1, it load increasing gradually but the deflection show more long time to crack. From these experiment the deflection was Late at 2.2mm compare to previous and this sample need load that is 9.8kN compare P1 so it was crack Late.
Sample P3
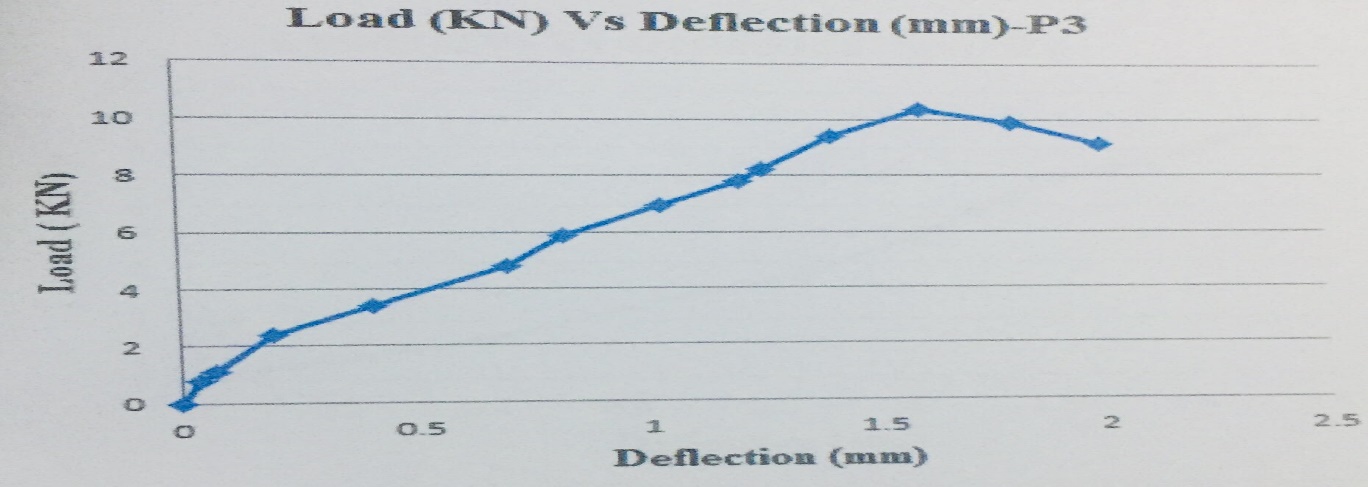
Figure 10 Load-deflection of sample P3
The deflection of the short span show that the deflection load needed is 10.4kN,but the deflection will take slightly long than P2, which is about 2 mm of the deflection to happened cracking. The load keep increasing until the machine detect cracking and it will stop to press the load down to the beam. After it reach the maximum and the value goes down it will stop the test.
Sample P4
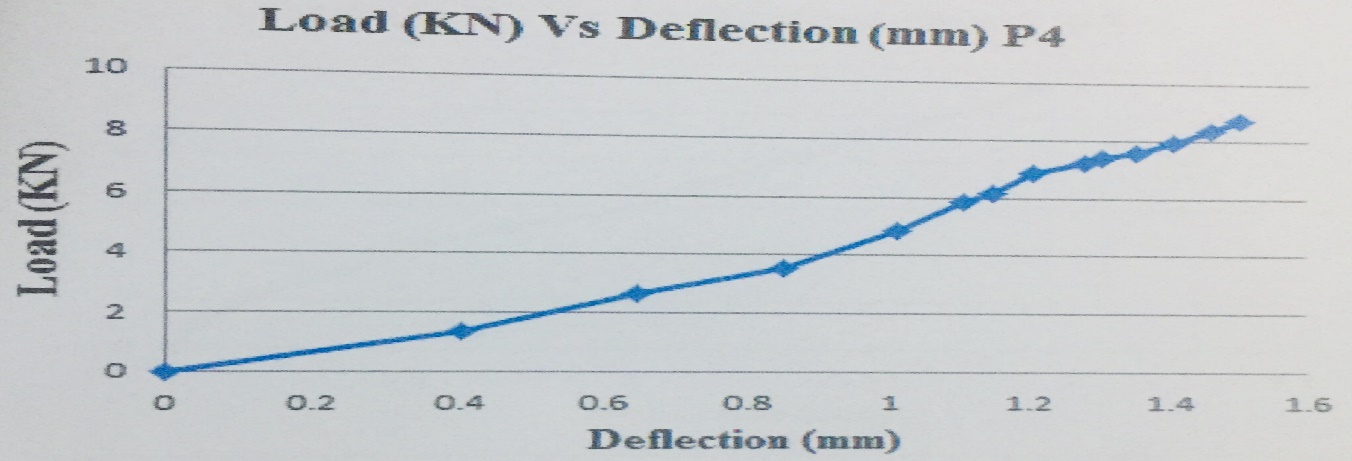
Figure 11 Load-deflection of sample P4
From the graph show the result gradually increase while the load is added. The load for the deflection test is 8.7 kN and the deflection is on 1.5 mm. At the range 1.0mm that is much changing on the deflection, which mean it still flexure increase that obviously. Compare to the previous sample all increase smoothly but these increase no at 1.0mm not that many but the load still increase at the same deflection point.
Sample P5

Figure 12 Load-deflection of sample P5
To get more consistency result so have test few sample which the range is within the 1.5 mm to 2.5 mm. The load need is about 11.10 kN is the highest in the test. The deflection for these short span beam is 1.9 mm only show the failure and the flexural crack been shown.
Sample P6

Figure 13 Load-deflection of sample P6
From the graph obtain the deflection increase after the 1.7 mm and the load is about 2.9 kN. After the load keep on increasing until reach the maximum and drop down .The load for these sample is 10.1kN. which the deflection is 2.8 mm.
SUMMARY
This chapter presented about the laboratory test result, data analysis and the discussion about the experimental result bending for partial prestressed prism. The prism was using concrete grade 60 with the mix proportion has been prepared. The compressive strength of concrete cube for 7 days and 28 days were tested under the compressive test machine, and the yield stress in five wire reinforcement of prism were tested under uniaxial tension using Universal Testing Machine (UTM) to determine the yield stress, ultimate stress, ultimate strain and elastic modulus,the entire specimen test were conducted at the Laboratories Of University Tun Hussein Onn Malaysia, UTHM.
CONCLUSION AND RECOMMENDATIONS
Conclusion
Compressive Strength Test
The concrete grade 60 was produced by adding superplasticizer and silica fumes achieve the higher strength grade concrete. To reduce the water cement ratio with the adding the superplasticizer into the admixture. Beside this, superplasticizer also improve the workability of the concrete to the mix proportional ratio. Although is reduce the ratio water binder, but while mixing the concrete some water are to be added into the mixture.
Tension Strength of Wire was tested
At first to cast the concrete must to obtain the result of the tension of the wire that can achieve the prestress stage in order. Which obtains the tensile strength of the wire by under Universal Test Machine (UTM). Under the test to obtain the result which can aid in the design partial prestress prism stage.
Flexural Behavior of Partial Prestress Prism has been prepared.
Design the partial prestress prism specimen were successfully achieved. The prestess sample was cast into a steel mold and stress by the mechanism. To obtain the flexural behavior were under the test of bending. By the test can observe the flexural crack pattern and obtain the failure result.
Recommendation
1. Recommend that the prestress wire can replace with the Glass Fiber Reinforcement Polymer GFRP, which can achieve higher tensile strength comparable to the bicycle wire strands. From the previous studied that has been carry show that the GFRP can reach to more than 1200MPa which the size is smaller than the wire strand.
2. Further study should replace the concrete grade 60 with the Geopolymer concrete to study the properties of Geopolymer.
3. The moisture curing should change to heating curing and the curing should be longer.
4. Durability of concrete grade 60 shall be studied for the carbonation and corrosion resistance in order to determine the potential application of concrete grade 60 in Civil Engineering construction.
5. Further research on the fine aggregate mixture can be fully replaced with the biomass aggregate to determine the determine the compressive strength of the concrete produced.
6. The percentage of the admixture such as superplasticizer, steel fiber, silica fumes can be increased to determine the contribution of each raw material to produce the concrete grade60.
References
- Dr. Amlan K Sengupta and Prof. Devdas Menon, October (2008) Prestressed Concrete Structures.
- Lee.k.h, July (1984) Deformation of partially prestressed concrete beams under service loads.
- Magnel, G. (1998) Prestressed Concrete Publications.
- Mustafa .b. (2006) Dawood ins-fantaneous deflection of partiallyprestressed concrete members.
- Nawy.E.G. (2006) Prestressed Concrete a Fundamental Approach 5th Edition Prentice-Hall.
- Ray Saiedi, December (2007) Load-Deflection Response of a Prestressed Concrete T-Beam.
- Roylance. D August (2001) stress-strain curves.
- Shady H. Salem, Khalid M. Hilal, July (2013) Experimental Behavior of Partially Prestressed High Strength Concrete Beams.
- Sunkurwar, R. R. (2011) Flexural Strength Behaviour of High Strength Prestressed
- Lee.K.H, July (1984) Deformation of partially prestressed concrete.
