

Asrar Hassan Alhaj1, Abdelsamed Ahmed Bakhit1, Rasha Eltayeb Abdellatif1
Red Sea University, Faculty of Engineering, Department of Electrical and Electronic Engineering, Sudan.
HNSJ, 2023, 4(3); https://doi.org/10.53796/hnsj4310
Published at 01/03/2023 Accepted at 12/02/2023
Abstract
The communication channel is the physical medium that is used to send the signal from the transmitter to the receiver. Through the channel, the transmitted signal is corrupted in a random manner by noise, this noise added to the signal. Because of this noise, the smeared version of the input signal is received at the receiver.
Therefore the received signal may be distorted and errors are introduced in the received signal. Thus, effects of noise due to communication channel limit the rate at which the signal can be transmitted. The probability of error in the received signal is normally used as performance measure of the digital communication system and called bit error rate (BER).
The objective of this paper is study and analysis for the BER in the presence of additive white Gaussian noise for main digital modulation schemes are done. The BER is calculated and simulated against signal to noise ratio (SNR) and the results are presented in graphs.
Finally, these results are compared, and the comparison shows that there is no clear difference between the simulation results and the theoretical calculation results.
Digital communication involves transmission of information in digital form from some source that generates the information to one or more destinations. A subject of particular importance in the analysis and design of communication systems is studying the characteristics of the physical channels through which the information is transmitted.[1]
The error rate is the degree of errors in the transmission of data due to bad hardware or noisy links. The higher the error rate the less reliable the connection or data transfer will be. In telecommunication transmission, the Bit Error Rate (BER) is the percentage of bits that have errors relative to the total number of bits received in a transmission, usually expressed as ten to a negative power [2]. The BER is an indication of how often a packet or other data unit has to be retransmitted because of an error. Too high a BER may indicate that a slower data rate would actually improve overall transmission time for a given amount of transmitted data, since the BER might be reduced, lowering the number of packets that had to be resent, [4].
- Methodology
The BER is calculated by changing the signal-to-noise ratio and finding out what would happen. This calculation can be considered as theoretical solution of BER calculation. After that, the BER is going to be simulated. This simulation will be performed by using Matlab (m-file) for simulation and evaluation the bit error rate (BER) and signal to noise ratio (SNR) for important digital modulation techniques that are widely used in communication industry. Finally, the results obtained from the theoretical calculations and the simulation software will be compared.
A digital signal waveform with binary signaling consists of two kinds of signals + and for .To simplify analysis without loss of generality, the time duration is set as From the point of view of detection theory, one can see two hypotheses. [3]:
H1 : s1 (t), 0 ≤ t ≤ T, is sent
H2: s2 (t), 0 ≤ t ≤ T, is sent
The energy of them is
In general these two signals may be correlated. We define
As the correlation coefficient of.
The received signal is
Where one of the two is is possible signals, and is the additive white Gaussian noise with zero mean and a two-sided spectral density of.[7]
- Error Probability for Binary PSK:
The bit error probability for BPSK can be derived from the formula for general binary signals. [6]
For BPSK thus
(Coherent BPSK)
However, coherent BPSK requires that the reference signal at the receiver to be synchronized in phase and frequency with the received signal.
3.1 Error Probability for Differential BPSK:
To derive the error probability of the optimum demodulator, we find that two DBPSK symbols are orthogonal over [0, 27] since
Where and can be obtained in chapter two
In other words DBPSK is a special case of noncoherent orthogonal modulation with and .[5]
Hence using the bit error probability for noncoherent detection of binary orthogonal signals in an AWGN channel the bit error probability is
(Optimum DBPSK)
3.2 Error Probability for M-ary PSK:-
An approximation to the error probability for large values of M and for large SNR given by:
Where
Note that this approximation to the error probability is good for all values of M, it is not needed for M = 2 and 4, in this cases the formulas can be used.[8]
The symbol error performance for differentially coherent detection of M-ary is DPSK (for large E/No) is similarly expressed as
The Functions used in Calculation:
- BPSK (coherent detected):
This expression can also be used to find, of QPSK.
- M-PSK (coherent detected)
- DPSK (noncoherent detected):
- DMPSK:
- Theoretical Calculation:
The matlab program used in this theoretical calculation and the results from it apparent in the Table (1) and Figure (1). The bit error-rate performance is usually depicted on a two dimensional graph. The X-axis vector is the normalized Signal-to-Noise ratio (SNR) expressed as (the energy-per-bit divided by the one-sided power spectral density of the noise), expressed in decibels (dB) and the range of it is from 0 to 10 in step of 1. The Y-axis vector is the bit-error-rate, a dimensionless quantity, usually expressed in powers of ten.[9]
Table (1): Results of BER Theoretical Calculation for BPSK
| Eb/n0 (dB) | Signal to noise ratio | BER simulation |
| 0 | 1.0000 | 0.0786 |
| 1 | 1.2589 | 0.0563 |
| 2 | 1.5849 | 0.0375 |
| 3 | 1.9953 | 0.0229 |
| 4 | 2.5119 | 0.0125 |
| 5 | 3.1623 | 0.0060 |
| 6 | 3.9811 | 0.0024 |
| 7 | 5.0119 | 0.0008 |
| 8 | 6.3096 | 0.0002 |
| 9 | 7.9433 | 0.0000 |
| 10 | 10.0000 | 0.0000 |
Fig (1): BER theoretical calculation curve
- Simulation of BER:-
This simulation has been performed by using Matlab (m-files) for simulation and evaluation the BER and SNR for digital modulation techniques.
5.1 Simulation Overview:
Bit Error Rate testing requires an overall system model, which includes a transmitter, a receiver, and a channel. Firstly generating a long sequence of random bits, which provide as input to the transmitter. The transmitter modulates these bits onto some form of digital signaling, which it send through a simulated channel. The channel it simulated by adding a controlled amount of noise to the transmitted signal. This noisy signal then becomes the input to the receiver. The receiver demodulates the signal, producing a sequence of recovered bits. Finally, the received bits are compared to the transmitted bits, after that the error was calculated, [10].
Simulation results are appeared in the Table (2) to and Figures (3). The flowchart for calculation program of BER is obtained in figure (2).
Input symbol size L
Initialize Loop i = 1
Increment i=i+1
Input Transmitted and Received Sequences s(1:N). r(1:N)
Error=s(1:N)-r(1:N)
M=L
Ps=0
Ps=0
i>M
Calculations Ps = Ps + any (error ((i- 1) “L+1: i*L))
NO
yes
Fig (2): simulation flow chart
Table (2) result of BER simulation for BPSK.
| Eb/n0 (dB) | Signal to noise ratio | BER simulation |
| 0 | 1.0000 | 0.0791 |
| 1 | 1.2589 | 0.0565 |
| 2 | 1.5849 | 0.0377 |
| 3 | 1.9953 | 0.0230 |
| 4 | 2.5119 | 0.0125 |
| 5 | 3.1623 | 0.0059 |
| 6 | 3.9811 | 0.0024 |
| 7 | 5.0119 | 0.0008 |
| 8 | 6.3096 | 0.0002 |
| 9 | 7.9433 | 0.0000 |
| 10 | 10.0000 | 0.0000 |
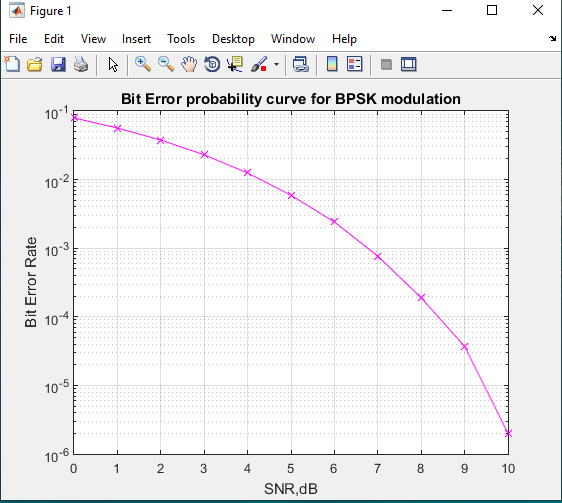
Fig (3): BER simulation
Comparison of results:
Table (3) Comparison of results between BER calculation and BER simulation
| Eb/N0 (dB) | Signal to noise ratio | BER simulation | BER calculation |
| 0 | 1.0000 | 0.0791 | 0.0786 |
| 1 | 1.2589 | 0.0565 | 0.0563 |
| 2 | 1.5849 | 0.0377 | 0.0375 |
| 3 | 1.9953 | 0.0230 | 0.0229 |
| 4 | 2.5119 | 0.0125 | 0.0125 |
| 5 | 3.1623 | 0.0059 | 0.0060 |
| 6 | 3.9811 | 0.0024 | 0.0024 |
| 7 | 5.0119 | 0.0008 | 0.0008 |
| 8 | 6.3096 | 0.0002 | 0.0002 |
| 9 | 7.9433 | 0.0000 | 0.0000 |
| 10 | 10.0000 | 0.0000 | 0.0000 |
- Conclusions and Recommendations:
7.1Conclusions:-
The bit error rate measurement is one of the prime considerations in determining signal quality. It is essentially needed for a reliable digital communication system from the previous chapters we conclude that:
- As what is expected, the BER increases when the signal-to-noise ratio decreases and vice versa, which means that the BER is inversely proportional to SNR.
- The probability of error at the output of the system depends upon the particular type of digital modulation, e.g. it is better for BPSK than that for BESK
- When the bit error rate is high, many bits will be in error. The worst- case is when BER is more than 50 percent, above which the modem is essentially useless as no error correction can recover errors.
- Usually the BER is plotted as a function of the SNR. At high SNRS, the bit error rate becomes very low. Such value requires a test signal containing millions or even billions of bits, in order to be measured and plotted.
- Each simulation must be generating some number of errors. If a simulation generates no errors, it does not mean the BER is zero; it only means it did not have enough bits in the transmitted signal.
- Finally the results of this work (theoretical and simulation) are satisfactory good, although there is no significant difference between the theoretical and simulation results.
7.2 Recommendations for Further Work:-
According to conclusions above, I suggest that experimental work is to be carried on to support theoretical work done within this project. Future work could include error detection and correction codes, in both theoretical and simulation models can be implemented.
Error correction codes have very effective role in the real world and it makes the BER better and gives significant difference in the comparison of experimental and simulation results.
- References
1- John. G. Proakis, “Digital Communications,” 4″ Edition, McGraw-Hill Inc, 2001 pp. 1-3, 260-273.
2. J. S. Chitode, “Digital Communication, Second Edition, Published by Technical Publications Pune, pp.7. 200-203, 236,237
3- Fugin Xiong, “Digital Modulation Techniques,” Artech House: Boston /
London, 2006.
4. Bob Watson, “FSK Signals and Demodulation,” Vol.7 NO.5 September/October 1980, pp. 1-5.
5- http://ec.eng.usm.my/ceacad/mandeep/EEE436/chp4.pdf, “Coherent
Binary Modulation Techniques,” pp. 1-10, 20, 21.
6- http://www.radio-electronic.com
7- Narayan B. Mandayam, “Wireless Communication Technologies,” Rutgers University – Dept of Electrical and Computer Engineering, Lectures Notes February 2002. pp. 1-3.
8. R.Santosh Kumar, “Performance of Mary NCFSK with Selection Combining over Different Fading Channels,” National Institute of Technology. Durgapur-713209, India April, 2009, pp.8-10.
9. http://searchcio-midmarket.techtarget.com
10. Niit. “Advanced Digital Communication System,” Eastern Economy Edition, Prentice-Hall of India, 2005, pp 4.5.