Hassan Hawas Hameedi AL-Husseini1 Dr. HAKAN SEPET2
AHİ EVRAN UNIVERSITY, Türkiye, Email: hassanmashity@gmail.com
AHİ EVRAN UNIVERSITY, Türkiye, Email: hakansepet@gmail.com
HNSJ, 2023, 4(6); https://doi.org/10.53796/hnsj469
Published at 01/06/2023 Accepted at 20/05/2023
Abstract
Many different goals can be served by processing digital photos, which is why there is such diversity in the subject of image processing. One of the foundations and essential tenets of computer vision is the image processing subfield, where basic operations like enhancing, cropping, and deleting unique characteristics are performed. You can use this method to determine the relative sizes of areas or objects in an image. We describe a study that makes use of cutting-edge computer vision techniques to investigate and assess palm tree plantations. Saladin, Iraqi date palm farms provide the data for this study. Trees are being mapped, analyzed, and categorized as well as cultivated and uncultivated land is being mapped. In the event of irrigation or tree-related calamities, the analysis can be used to exert control over these zones. According to the findings, our proposed method for identifying, analyzing, and classifying trees based on their crowns is superior.
1 – Introduction
Unmanned aerial vehicle (UAV) imagery has emerged as a powerful resource for aerial image processing in recent years. The preprocessing phase is determined by factors such as the height and quality of the collected images, as well as other physical characteristics [1]. Images are fed into image processing software to determine the number of trees present.
Trees and public parks are crucial to city life for reasons related to both human health and the preservation of green space. Numerous high-tech instruments are needed for tree care and maintenance. Some of these machines are sensors, like cameras, installed in the ground around trees [2], while others are used to water crops. With an ever-increasing number of trees, public parks require continual monitoring in order to make informed decisions about resource allocation.
Data on tree density is useful for assessing the state of trees in general. Case disclosure reports are readily available to ensure that all policies are followed. Since trees often, it is impossible to tell their species apart or estimate their density from ground-level views alone; aerial photographs are required. Aerial photographs are useful for estimating the density of tree plantings, and they can reveal the presence or absence of trees within a given plot. Aerial photography can be done in a variety of ways.
Drones are the most practical and precise tool for taking multiple photographs of the same scene from varying heights [3]. In this thesis, we propose the concept of using aerial pictures of city parks for analysis and processing. The ratio of the total area to the area covered by trees is one way to quantify tree density.
2 – Literature Review
Prior research has predominantly concentrated on a subject matter akin to our proposed concept. Nath et al. conducted a study on the quantification of palm trees using drone imagery, as documented in their research publication [4]. In this study, we propose a novel approach for detecting palm trees in drone images using a gradient vector flow exploration technique. The determination of symmetry is predicated upon the direction of the gradient of the pixels. Each pixel’s diagonal dominating points are labeled using the angle data. Using the YOLO construct, the pseudo-region of interest was eliminated, which helped to significantly lessen the complicated backdrop impact. This step involves quantifying the number of palm trees present in the given image.
In their research, Yu-Hsuan Tu and colleagues proposed a method to enhance the flight planning of unmanned aerial vehicles (UAVs) for the purpose of measuring the structure of tree crops in horticulture. This was documented in a scientific paper [5]. Optimizing the parameters for identifying the optimal flight is crucial due to its impact on the quality of the resulting images. Prior research has assessed the influence of singular variables on the quality of images. This study aims to investigate the effects of diverse flight variables on data quality metrics at each stage of image processing and to determine precise measurements of tree crops. The findings indicate that conducting aerial surveys adjacent to the fence during periods of high solar elevation and with reduced viewing angles can enhance the precision and accuracy of the collected data. The research suggests that in order to attain the necessary forward intervention, it is advisable to establish the optimal flight velocity.
Jian Zhang et al [6] conducted a scientific investigation on the structure of forests and trees. The vertical stratification of the forest is characterized by the arrangement of species within its ecosystem. In this research, a drone was employed to evaluate the spatial heterogeneity of canopy architecture in five subtropical forest ecosystems in China. The objective of the study was to investigate the significance of canopy architecture and terrain features in influencing the variety of trees and distribution of species. An optimization process was conducted by incorporating topographic data, spatial distribution, and canopy characteristics of more than 533,000 individuals belonging to over 600 tree species. Concurrent spatial autoregressive error models were employed in the investigation to evaluate the relative significance of individual variables with respect to species diversity. The research findings indicate that canopy structure variables have a significant impact on the distribution of tree species across various forest layers and plots. The study’s findings suggest that the arrangement of species within these forested areas is impacted by the interplay between the structure of the canopy and the topographical features of the terrain.
In their study, Tu et al. [7] investigated the optimization of travel arrangements through the design of different configurations. The significance of strategic planning lies in its capacity to enhance the precision and accuracy of images and maps derived from the biophysical characteristics of vegetation. In the process of flight planning, multiple parameters are taken into account, including flight altitude, degree of image overlap, flight direction, flight speed, and solar altitude. A comprehensive investigation has been conducted to develop the most efficient aerial images captured by unmanned aerial vehicles. Prior studies have assessed the influence of singular variables on image quality, however, the interplay between multiple variables remains unexplored. The research conducted by the investigators showcased the influence of diverse flight parameters on data quality metrics during every phase of processing, encompassing image registration, point cloud densification, 3D reconstruction, and ortho-rectification. The results of the study indicate that the proximity of the flight to the fence during periods of high solar altitudes and low viewing angles has a positive impact on the quality of the data obtained. The confidence in the precision of subsequent algorithms and maps generated by biophysical features has been progressively improved.
Aerial imagery is utilized for monitoring the advancement or enlargement of specific trees. In their research, Petra B. Holden and colleagues [8] investigated the application of aerial image analysis and tree growth monitoring to overcome the difficulties in implementing remote sensing for controlling invasive weeds. The study was undertaken in response to the limited number of comprehensive remote sensing investigations carried out on water towers, which have the potential to jeopardize water safety through the proliferation of non-native tree species. In this study, we employed an innovative interdisciplinary approach that combines the computational power of the Google Earth Engine platform with freely available Sentinel images. The study employed the use of drone technology and field trips to provide a precise and current comprehension of the occurrence and density of non-indigenous tree species in a significant watershed in the South-West area of the South African Cape. The research findings indicate that decision makers have articulated a demand for tailored solutions that can efficiently handle non-native tree species.
The savanna’s contribution to ecological balance is vital to human well-being. The savanna in Africa is a crucial ecological zone. These methods allow for a more accurate description of tree-based group structures. Authors M. Bossoukpe et al [9] To determine if it would be possible to use commercial economic drones to describe trees on the plains, research was undertaken. Twenty-four plots were mapped using a Dji Spark drone in the region north of Senegal. Using the gathered images, an accurate forest elevation model was developed. More than 200 trees had their heights and crown widths measured physically in the field. The data collected by drones in the crown area corresponded very well with those collected manually. Predictions regarding tree species were made using a random forest categorization system.
These results demonstrate that forestry groups and academics may successfully use economical drones to evaluate tree structures in forests in the pursuit of tree communities and information dissemination.
3 – Material and Method
A significant amount of literature has been reviewed, and its knowledge has been utilized. enhanced rendering of drone-captured images. Our research concept is crucial to the study and evaluation of tree-containing areas. The study of tree density is conducted by constructing a model using image processing techniques. Those responsible for making decisions are aided by the existence of a mechanism to identify and analyze parks in public spaces, whether in normal or disaster situations. The density of trees in the area can also be used to estimate the extent of the need to plant new trees. The system is applied to actual photographs captured in parks. This concept is recommended for use in the majority of gardens requiring research and analysis.
To guarantee a precise assessment of tree density in the photographed photos, our research proposes a number of image processing techniques. We’ll do our own data preparation. To get a better sense of the layout of the region, photographs will be taken from a variety of angles and heights. Image Enhancement is the initial procedure. Various methods exist for optimizing photos for processing. Blurring the picture, fixing the colors, and redistributing the light are all significant goals [10]. Changing the contrast and brightness uniformly distributes color tones.
picture Segmentation follows the initial phase of picture creation. For segmentation, we can utilize threshold methods [11]. The field of automatic picture segmentation has become increasingly relevant in recent years. Segmentation is the process of isolating and isolating certain parts of a picture from one another. Our study’s defining features include tree-like structures. Segmentation can be accomplished in a number of methods, such as by the detection of distinct edges, the identification of regions of homogenous color or pattern, or the use of contextual knowledge.
Once these unique features have been isolated, other procedures may be carried out, such as recognizing them or determining their relative size relative to the image’s overall area. Some picture elements, such edges, may have needed to be brought to the fore in earlier processing steps. Before a picture is processed further, it can be filtered using several methods. To apply a filter to a picture, one simply passes it over the pixels, adding the product to the original image to determine the value of each filtered pixel. Preprocessing is required in most intelligent systems; for example, grayscale pictures are typically discussed in the aforementioned fields since they are simpler and can be processed more quickly than color images. More information is included in color images than in grayscale images, making color image processing crucial.
Natural forests are vital to the world ecology and must be preserved. Forest monitoring should start this initiative. RS data is an efficient forest conservation monitoring tool. Timely forest monitoring data analysis procedures are also vital [12]. Manual counting and tree detection are not possible due to the forest polygons’ vastness and inaccessibility. In instance, resource-intensive processing of a significant volume of unsorted RS data from drones might entail expert judgment on tree type and human counting of specimens with a specified crown integrity. Date production management requires counting date palm plants and finding density zones. Amazon and Middle Eastern nations have these trees. Using rudimentary classical approaches to acquire tree information wastes a lot of work and time and yields low accuracy [13]. New drone imaging techniques can create and study a palm tree map more precisely. Drone photos combined for training and testing can increase palm tree detection and counting based on plant density and deterioration of trees and other agricultural land. Palm tree monitoring, management, and exploration can benefit from drone data and sensor system advancements.
3-1 The dataset
The Sumerians are credited for planting the date palm in the Mesopotamian Valley and living off its fruits [32]. Over 3000 BC. Since then, palm groves have grown and diversified, becoming one of the population’s main food sources. These trees vary in economic value by continent and nation according to environmental circumstances. These trees number around 100 million [14]. The date palm’s early expansion to the Persian Gulf suggests its origin there.
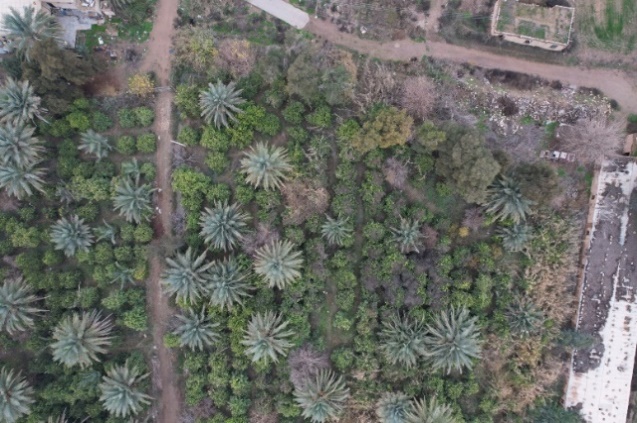
South Africa, Australia, the Americas, and southern Europe were home to ancient palm species between 10 and 35 degrees north of the equator. These territories ranged from the Valley in Pakistan to the Canary Islands in the Atlantic Ocean. However, the 10th and north 35th latitudes are rare and have minimal economic significance. Due to the relevance and economic worth of this tree, we will explore and analyze techniques to uncover and study its features utilizing drone data like Figure 1.
 |
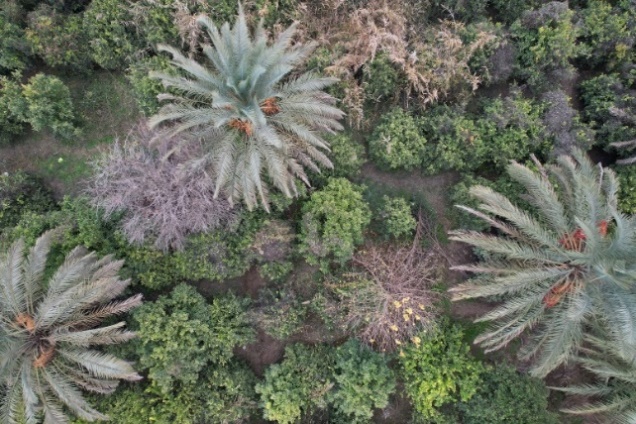 |
Figure 1: Example of dataset images
3-2 Working Area
Salah Al-Din Governorate in Iraq was the site of the research. The province of Saladin Governorate is one of the most significant in terms of agricultural richness, and it is also one of the greatest provinces in terms of the number of trees per square kilometer. Trees, especially palm trees, cover a lot of ground. Many people in this province make their living off of the date industry due to its importance to the local economy.
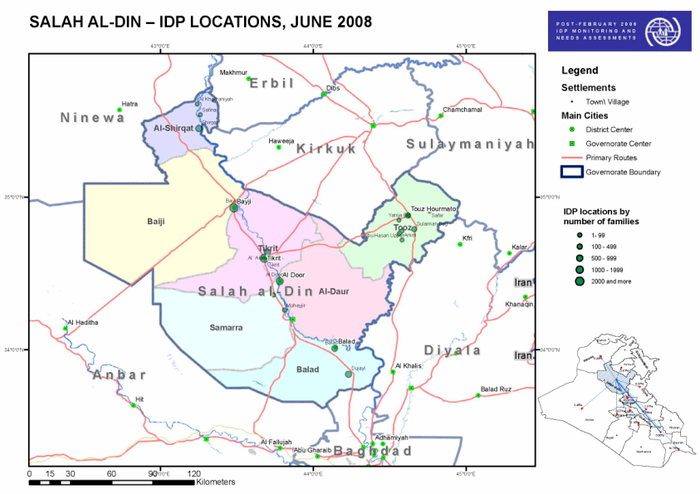
Figure 2. Study area – Salahaldeen, Iraq [15]
Drone technology and aerial photography can greatly aid in the preservation and upkeep of these forests. These pictures are sent into image processing tools that then generate reliable data on tree quality and examine planted regions.
3.3 Deep Neural Network
Modern approaches for data analysis and categorization frequently employ deep neural networks. Convolutional neural networks (CNN) and recurrent neural networks (RNN) are two of the most often used DNN kinds [16]. His work has resulted in several ground-breaking developments in the field of data analysis. Because the approaches concentrate on the binary categorization of labeled data, they were chosen for the model. Since there is no one-size-fits-all solution, deep learning models like the neural network and the convolutional neural network were also put to the test.
It has been observed that incorporating a CNN model in a Convolutional Neural Network can enhance the decision-making process of the network. This is achieved by introducing a linear transform to a standard neural network and extracting both local and global features from the input [17]. In a CNN network, middleware layers are often incorporated alongside convolutional layers to offer more precise control over its operation. Additional details regarding them are provided below. The CNN deep learning model is widely used in various applications such as image and video recognition, recommendation systems, image classification, medical image analysis, and natural language processing.
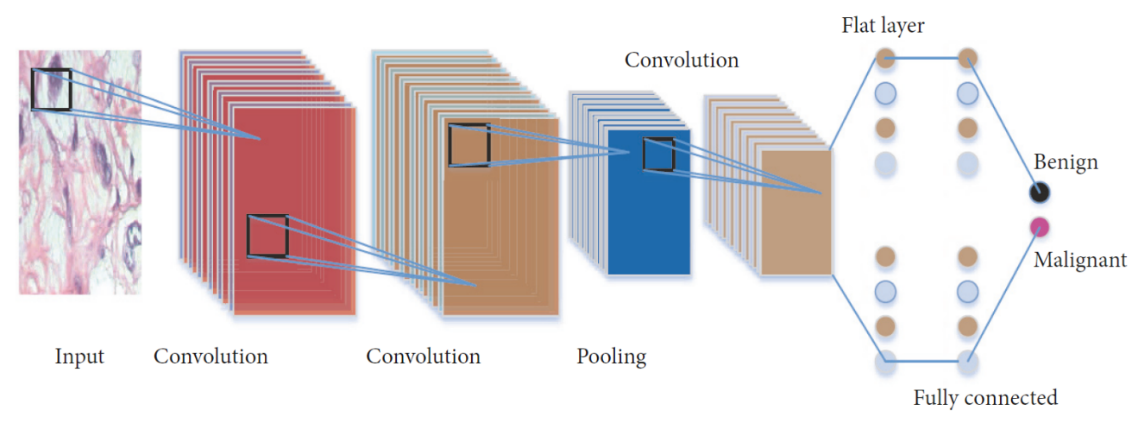
Figure 3. Workflow of a Convolutional Neural Network [18]
Compared to other image classification algorithms, it can be said that CNNs require minimal preprocessing to become operational [19]. CNNs have some unique characteristics that distinguish them from other types of neural networks. It’s worth noting that layers possess a multi-dimensional structure, meaning they are arranged both horizontally and vertically, as well as on a plane. Additionally, the Evolutionary Layer model placed significant emphasis on A, which was considered its main advantage. The convolution layer heavily relies on the kernel as its main component. Tasked with examining all input data and attempting to extract overall characteristics from them. The term “step” pertains to the complete number of steps that a core accomplishes within a single iteration. It may be helpful to ensure that the appropriate step size and dimensions are selected in order to accurately align the boundary row and column positions.
3-4 Neural Network Layers
It appears that each network typically consists of a single input layer and a single output layer. It appears that the number of input variables in the data being processed is related to the number of neurons in the input layer. It is worth noting that the number of neurons in the output layer is directly proportional to the number of outputs associated with each input. One aspect that requires careful consideration is determining the appropriate number of hidden layers and the neurons that comprise them, as noted in reference [20]. The input layer primarily serves to transmit information to the hidden nodes, without performing any significant calculations.
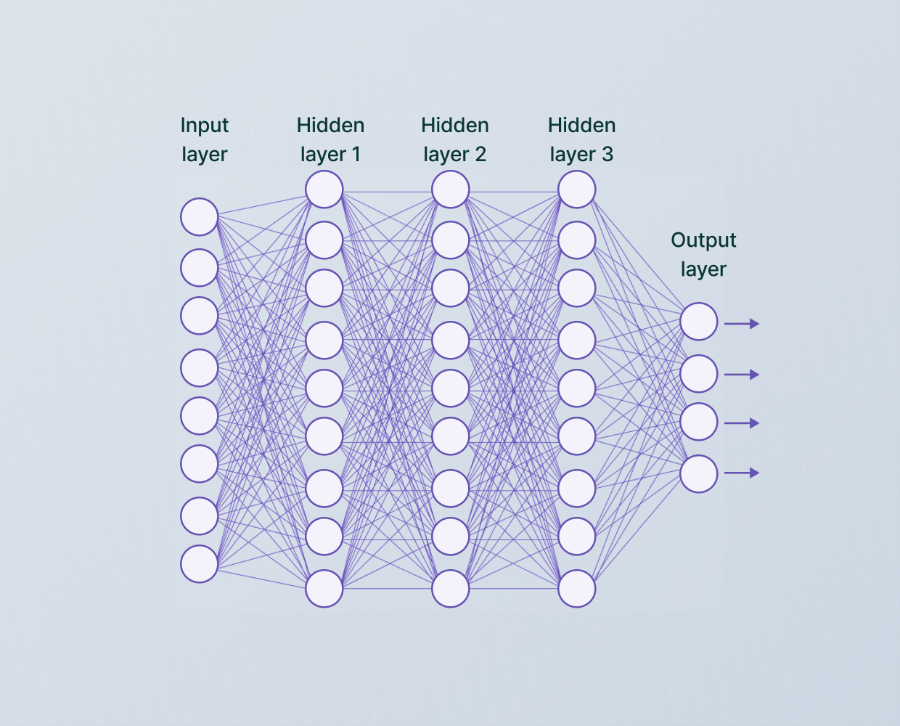
Figure 4. convolutional neural network layers [21]
In the hidden layer, complex computations are performed and the data is transferred from the input nodes to the output nodes. It is worth noting that while a network typically consists of a single input and output layer, it is indeed possible to incorporate multiple hidden layers. The output layer is responsible for transferring information from the network to the outside world through its computations [22]. Convolutional Neural Networks often consist of hidden layers that include components such as convolutional layers, pooling layers, fully connected layers, and normalization layers.
3-5 Suggested Model
Our proposed model, as depicted in Figure 5, draws inspiration from similar studies in this field to create an integrated approach. Currently, we are in the process of reading the images from the dataset and the subsequent steps involve performing necessary preprocessing on the images. It is possible that some users may find that images captured by drones may not always meet their accuracy and efficiency requirements. It’s possible that certain photos were captured in less than ideal circumstances, such as challenging lighting, inclement weather, or air pollution.
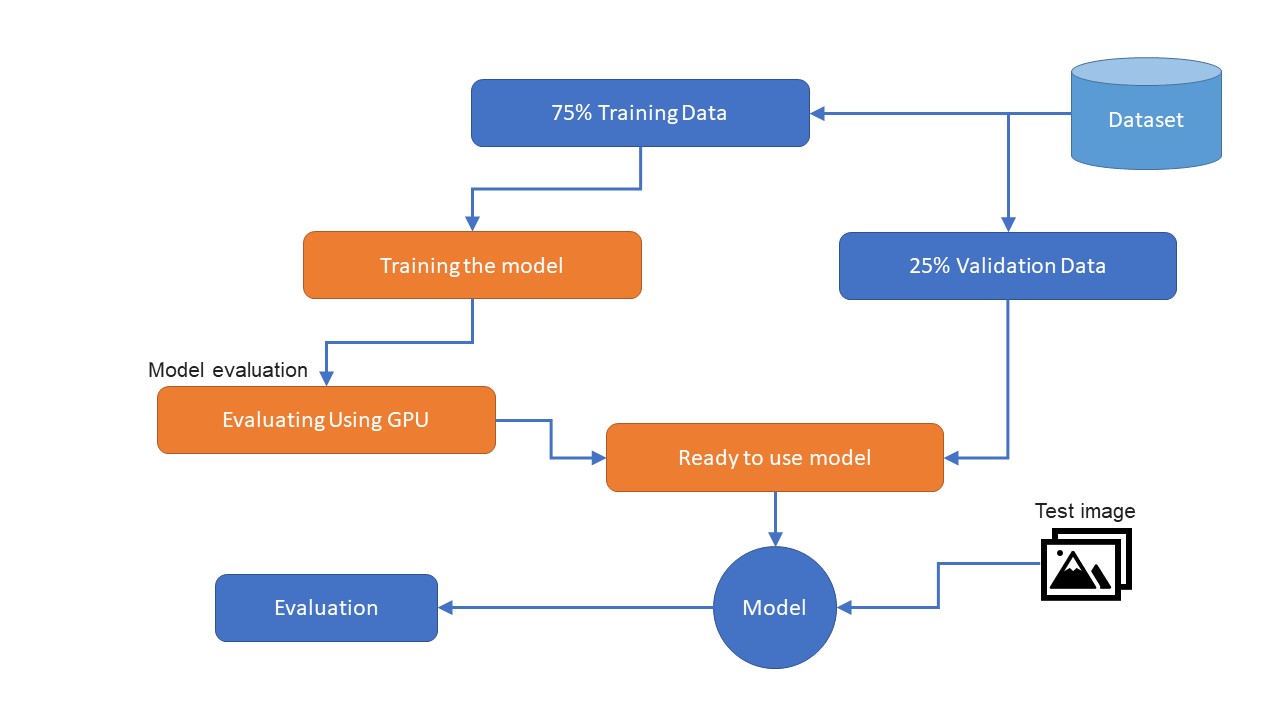
Figure 4. Proposed model diagram
As a next step, the data is divided into two parts based on the previously mentioned ratios. The proposed model utilizes a split of 75% of the dataset for training, and 25% for validation and testing purposes. This method is known for its ability to divide data into models that are recognized for their efficiency and high accuracy in producing ratios and results. Developing precise models is crucial for generating reliable reports. Our proposed system’s accuracy is evaluated through various methods, including the utilization of the GPU, which entails generating an aerial rendering model. Once the images have been obtained and trained for the model, it proceeds to the correction phase where the dataset image portion is utilized.
Upon evaluating the performance and application of the proposed model with the data, it appears that we have achieved a high level of accuracy in our results. Images of palm trees captured from Saladin’s farms were utilized. In every testing process, we strive to obtain a comprehensive description of the trees, accurately calculate their properties, and ensure the validity of our findings. In the report presented to stakeholders, the cultivated and uncultivated areas are compared. It would be beneficial to consider utilizing modern technologies to assess the potential of farms and determine the appropriate number of trees needed. The findings can be utilized to safeguard trees and capitalize on information regarding potential hazards they may face.
4 – Experimental Results
The study area is located on the territory of a natural agricultural reserve located near the city of Salah al-Din in central Iraq. Most of the land (80%) is located in the middle of the mountain belt (300-400 meters above sea level) and most of it is covered with mixed farms with seven tree species in varying proportions. are palm trees. Palm trees dominate among other species and occupy 41% of the total plantation area, especially in the plains. Since the aim of the study was to protect and diversify palm trees (25% of the total farm area), test plots with this tree species were selected for the experiment.
Based on the initial investigation of available palm trees detection tools, it was found that some algorithms [23][24] had a higher success rate in accurately identifying the crown region of a certain percentage of trees. The project encountered some difficulties such as the need to accurately segment large trees, occasional misidentification of tree objects due to ground model defects, and the presence of non-tree vertical objects. The proposed model aims to enhance the partitioning of large trees and minimize redundancy by integrating both self-monitored and manually annotated datasets. The full model has been observed to perform optimally in areas where there are well-spaced large trees. However, it has been noted that the model may subdivide small tree clusters, as depicted in Figure 5.
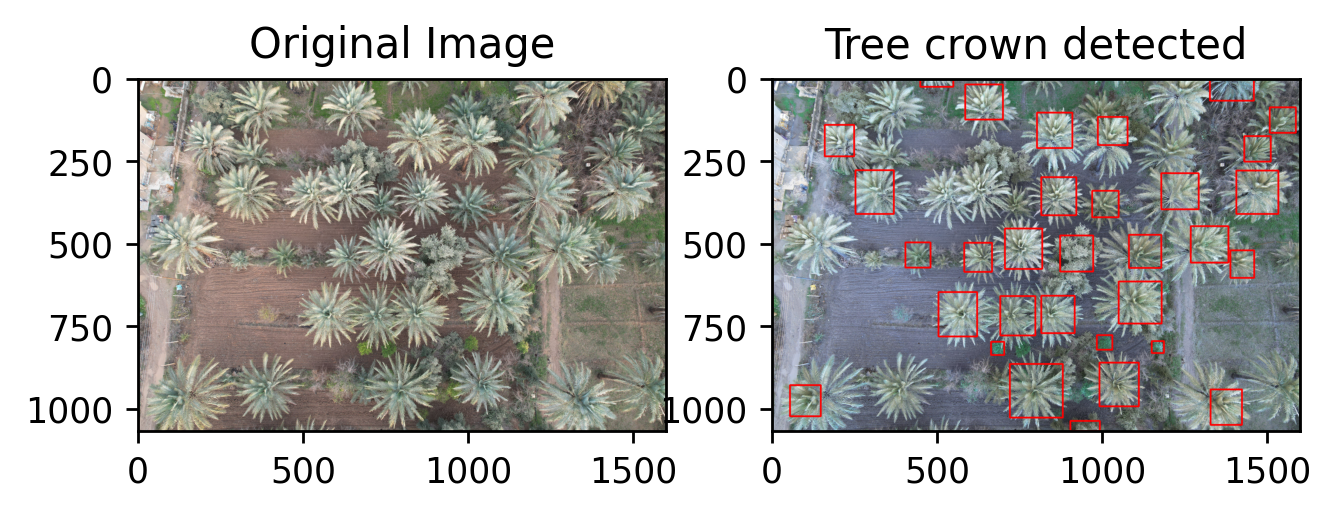
Figure 5. the result of the presented model
shows palm tree crown detection with different crown sizes, 32 of 35 crowns were detected with detection accuracy of 92%. Table 1 shows the information of the detected palm trees. the average rate of IoU detection is 92 %, which the F-score is 94 %. Table 2 shows the IoU and F-score of 15 detected crown of palm trees.
Table 1. Information of palm trees detected in Figure 5.
| # | Information of detected trees |
| Box 1 covering from xmin: 1048 ymin: 614 xmax: 1178 ymax: 741 totaling area of 16510 square pixel | |
| Box 2 covering from xmin: 814 ymin: 299 xmax: 920 ymax: 414 totaling area of 12190 square pixel | |
| Box 3 covering from xmin: 990 ymin: 859 xmax: 1109 ymax: 991 totaling area of 15708 square pixel | |
| Box 4 covering from xmin: 982 ymin: 776 xmax: 1029 ymax: 820 totaling area of 2068 square pixel | |
| Box 5 covering from xmin: 503 ymin: 646 xmax: 620 ymax: 780 totaling area of 15678 square pixel | |
| Box 6 covering from xmin: 1266 ymin: 447 xmax: 1380 ymax: 557 totaling area of 12540 square pixel | |
| Box 7 covering from xmin: 968 ymin: 340 xmax: 1048 ymax: 420 totaling area of 6400 square pixel | |
| Box 8 covering from xmin: 814 ymin: 657 xmax: 915 ymax: 770 totaling area of 11413 square pixel | |
| Box 9 covering from xmin: 1404 ymin: 279 xmax: 1531 ymax: 410 totaling area of 16637 square pixel | |
| Box 10 covering from xmin: 704 ymin: 454 xmax: 817 ymax: 576 totaling area of 13786 square pixel | |
| Box 11 covering from xmin: 584 ymin: 19 xmax: 698 ymax: 125 totaling area of 12084 square pixel | |
| Box 12 covering from xmin: 581 ymin: 497 xmax: 665 ymax: 585 totaling area of 7392 square pixel | |
| Box 13 covering from xmin: 1505 ymin: 88 xmax: 1584 ymax: 165 totaling area of 6083 square pixel | |
| Box 14 covering from xmin: 1386 ymin: 520 xmax: 1458 ymax: 603 totaling area of 5976 square pixel | |
| Box 15 covering from xmin: 1428 ymin: 175 xmax: 1508 ymax: 252 totaling area of 6160 square pixel | |
| Box 16 covering from xmin: 1148 ymin: 794 xmax: 1185 ymax: 830 totaling area of 1332 square pixel | |
| Box 17 covering from xmin: 1079 ymin: 473 xmax: 1177 ymax: 573 totaling area of 9800 square pixel | |
| Box 18 covering from xmin: 801 ymin: 104 xmax: 908 ymax: 211 totaling area of 11449 square pixel | |
| Box 19 covering from xmin: 871 ymin: 475 xmax: 971 ymax: 584 totaling area of 10900 square pixel | |
| Box 20 covering from xmin: 403 ymin: 496 xmax: 479 ymax: 572 totaling area of 5776 square pixel | |
| Box 21 covering from xmin: 690 ymin: 658 xmax: 796 ymax: 777 totaling area of 12614 square pixel | |
| Box 22 covering from xmin: 985 ymin: 117 xmax: 1075 ymax: 202 totaling area of 7650 square pixel | |
| Box 23 covering from xmin: 719 ymin: 863 xmax: 879 ymax: 1025 totaling area of 25920 square pixel | |
| Box 24 covering from xmin: 448 ymin: 0 xmax: 548 ymax: 26 totaling area of 2600 square pixel | |
| Box 25 covering from xmin: 252 ymin: 278 xmax: 368 ymax: 410 totaling area of 15312 square pixel | |
| Box 26 covering from xmin: 1326 ymin: 940 xmax: 1421 ymax: 1047 totaling area of 10165 square pixel | |
| Box 27 covering from xmin: 159 ymin: 141 xmax: 248 ymax: 236 totaling area of 8455 square pixel | |
| Box 28 covering from xmin: 1324 ymin: 0 xmax: 1457 ymax: 68 totaling area of 9044 square pixel | |
| Box 29 covering from xmin: 662 ymin: 796 xmax: 702 ymax: 836 totaling area of 1600 square pixel | |
| Box 30 covering from xmin: 1177 ymin: 287 xmax: 1290 ymax: 396 totaling area of 12317 square pixel | |
| Box 31 covering from xmin: 54 ymin: 927 xmax: 147 ymax: 1021 totaling area of 8742 square pixel | |
| Box 32 covering from xmin: 902 ymin: 1035 xmax: 991 ymax: 1066 totaling area of 2759 square pixel |
Table 2 The IoU and F-score of 15 detected crown of palm trees
| No | prediction_id | T_id | IoU | score | xmin | xmax | ymin | ymax | predicted_label | true_label | match |
| 1 | 0 | 0 | 0.9581 | 0.9933 | 195 | 238 | 115 | 158 | Tree | Tree | TRUE |
| 2 | 8 | 3 | 0.9393 | 0.9515 | 165 | 197 | 133 | 170 | Tree | Tree | TRUE |
| 3 | 13 | 4 | 0.9315 | 0.8517 | 189 | 222 | 74 | 108 | Tree | Tree | TRUE |
| 4 | 9 | 5 | 0.8911 | 0.9394 | 88 | 127 | 237 | 281 | Tree | Tree | TRUE |
| 5 | 12 | 6 | 0.9156 | 0.8582 | 125 | 147 | 277 | 302 | Tree | Tree | TRUE |
| 6 | 7 | 7 | 0.8668 | 0.9625 | 87 | 133 | 354 | 400 | Tree | Tree | TRUE |
| 7 | 5 | 8 | 0.8824 | 0.973 | 22 | 61 | 351 | 392 | Tree | Tree | TRUE |
| 8 | 1 | 9 | 0.939 | 0.9927 | 24 | 73 | 243 | 291 | Tree | Tree | TRUE |
| 9 | 2 | 10 | 0.9103 | 0.9901 | 33 | 79 | 305 | 352 | Tree | Tree | TRUE |
| 10 | 6 | 12 | 0.9139 | 0.9698 | 320 | 394 | 0 | 61 | Tree | Tree | TRUE |
| 11 | 4 | 13 | 0.8626 | 0.9792 | 309 | 354 | 74 | 113 | Tree | Tree | TRUE |
| 12 | 10 | 14 | 0.9179 | 0.92 | 270 | 359 | 285 | 383 | Tree | Tree | TRUE |
| 13 | 15 | 1 | 0.9214 | 0.8531 | 359 | 400 | 327 | 381 | Tree | Tree | TRUE |
| 14 | 13 | 4 | 0.9509 | 0.8659 | 83 | 123 | 152 | 192 | Tree | Tree | TRUE |
| 15 | 2 | 5 | 0.9142 | 0.9861 | 213 | 275 | 135 | 207 | Tree | Tree | TRUE |
As the information which has been presented, the box location in Ymin and Xmin with the size in pixels. From Figure 5 and Table 1 and 2, we analyze the area covered (square pixels) by bounding boxes (detected tree crown)) on used data base of palm trees seen in the Figure 6, which is 20 % out of all area in the image.
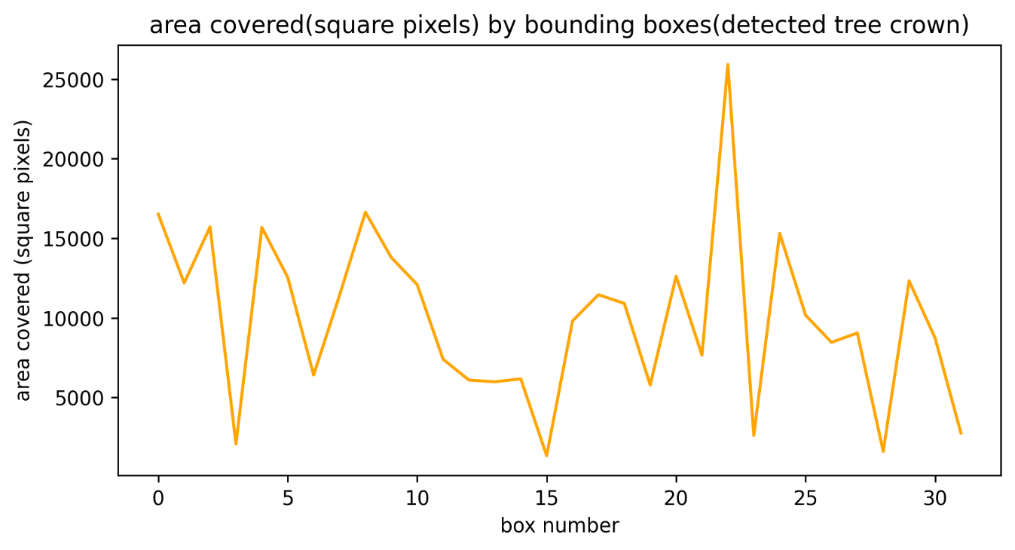
Figure 6. covered area of palm tree crowns
Conclusions and future work
Applications that aid people in their daily lives have demonstrated their value. One of the key uses of our proposal is protecting the environment during palm tree production, which is just one of many benefits. Drone-taken photos of date palm fields in Salah al-Din inspired us to implement our plan. During the model’s development and testing phases, these photographs were used. Very high detection accuracy rates demonstrated the advantages of our suggested technique for locating the crown of trees. However, it was suggested that they be used extensively because of the significance of classifying trees and assessing the cultivated and uncultivated land. The study’s scope can be broadened in the future to incorporate other areas and governorates. It’s also feasible to include a wide range of tree species and cultivars.
References
[1] Morales, G., Kemper, G., Sevillano, G., Arteaga, D., Ortega, I., & Telles, J. (2018). Automatic segmentation of Mauritia flexuosa in unmanned aerial vehicle (UAV) imagery using deep learning. Forests, 9(12), 736.
[2] Pajares, G. (2015). Overview and current status of remote sensing applications based on unmanned aerial vehicles (UAVs). Photogrammetric Engineering & Remote Sensing, 81(4), 281-329.
[3] Donmez, C., Villi, O., Berberoglu, S., & Cilek, A. (2021). Computer vision-based citrus tree detection in a cultivated environment using UAV imagery. Computers and Electronics in Agriculture, 187, 106273.
[4] Chowdhury, Pinaki Nath, Palaiahnakote Shivakumara, Lokesh Nandanwar, Faizal Samiron, Umapada Pal, and Tong Lu. “Oil palm tree counting in drone images.” Pattern Recognition Letters 153 (2022): 1-9.
[5] Tu, Yu-Hsuan, Stuart Phinn, Kasper Johansen, Andrew Robson, and Dan Wu. “Optimising drone flight planning for measuring horticultural tree crop structure.” ISPRS Journal of Photogrammetry and Remote Sensing 160 (2020): 83-96.
[6] Zhang, J., Zhang, Z., Lutz, J. A., Chu, C., Hu, J., Shen, G., … & He, F. (2022). Drone-acquired data reveal the importance of forest canopy structure in predicting tree diversity. Forest Ecology and Management, 505, 119945.
[7] Tu, Y. H., Phinn, S., Johansen, K., Robson, A., & Wu, D. (2020). Optimising drone flight planning for measuring horticultural tree crop structure. ISPRS Journal of Photogrammetry and Remote Sensing, 160, 83-96.
[8] Holden, P. B., Rebelo, A. J., & New, M. G. (2021). Mapping invasive alien trees in water towers: A combined approach using satellite data fusion, drone technology and expert engagement. Remote Sensing Applications: Society and Environment, 21, 100448.
[9] Bossoukpe, M., Faye, E., Ndiaye, O., Diatta, S., Diatta, O., Diouf, A. A., … & Taugourdeau, S. (2021). Low-cost drones help measure tree characteristics in the Sahelian savanna. Journal of Arid Environments, 187, 104449.
[10] Janani, P., J. Premaladha, and K. S. Ravichandran. “Image enhancement techniques: A study.” Indian Journal of Science and Technology 8, no. 22 (2015): 1-12.
[11] Al-Amri, Salem Saleh, and Namdeo V. Kalyankar. “Image segmentation by using threshold techniques.” arXiv preprint arXiv:1005.4020 (2010).
[12] Banskota, A., Kayastha, N., Falkowski, M. J., Wulder, M. A., Froese, R. E., & White, J. C. (2014). Forest monitoring using Landsat time series data: A review. Canadian Journal of Remote Sensing, 40(5), 362-384.
[13] Fernández, E., Junquera, B., & Ordiz, M. (2003). Organizational culture and human resources in the environmental issue: a review of the literature. International Journal of Human Resource Management, 14(4), 634-656.
[14] Mathijsen, D. (2021). The challenging path to add a promising new bio-fiber from an overlooked source to our reinforcement toolbox: Date palm fibers. Reinforced Plastics, 65(1), 48-52
[15] https://reliefweb.int/map/iraq/iraq-salah-al-din-governorate-reference
[16] Yin, W., Kann, K., Yu, M., & Schütze, H. (2017). Comparative study of CNN and RNN for natural language processing. arXiv preprint arXiv:1702.01923
[17] Kattenborn, T., Leitloff, J., Schiefer, F., & Hinz, S. (2021). Review on Convolutional Neural Networks (CNN) in vegetation remote sensing. ISPRS journal of photogrammetry and remote sensing, 173, 24-49.
[18] Prabhu “ Understanding of Convolutional Neural Network (CNN) — Deep Learning” 2018 – https://medium.com/@RaghavPrabhu/understanding-of-convolutional-neural-network-cnn-deep-learning-99760835f148
[19] Pal, K. K., & Sudeep, K. S. (2016, May). Preprocessing for image classification by convolutional neural networks. In 2016 IEEE International Conference on Recent Trends in Electronics, Information & Communication Technology (RTEICT) (pp. 1778-1781). IEEE.
[20] Allen-Zhu, Z., Li, Y., & Liang, Y. (2019). Learning and generalization in overparameterized neural networks, going beyond two layers. Advances in neural information processing systems, 32
[21] https://www.v7labs.com/blog/convolutional-neural-networks-guide
[22] Ajit, A., Acharya, K., & Samanta, A. (2020, February). A review of convolutional neural networks. In 2020 international conference on emerging trends in information technology and engineering (ic-ETITE) (pp. 1-5). IEEE.
[23] Safonova, A., Hamad, Y., Dmitriev, E., Georgiev, G., Trenkin, V., Georgieva, M., … & Iliev, M. (2021). Individual tree crown delineation for the species classification and assessment of vital status of forest stands from UAV images. Drones, 5(3), 77.
[24] Safonova, A., Hamad, Y., Alekhina, A., & Kaplun, D. (2022). Detection of Norway Spruce Trees (Picea Abies) Infested by Bark Beetle in UAV Images Using YOLOs Architectures. IEEE Access, 10, 10384-10392.
