Yousif Elfatih Yousif 1 , Hoyam Salah Elfahal 2
Department of Computer Engineering, Faculty of Engineering, Alzaiem Alazhari University, Khartoum, Sudan
Email: yousifsiddiq@gmail.com
2 Department of Computer Engineering, Faculty of Engineering, Alzaiem Alazhari University, Khartoum, Sudan
Email: hoyam090@hotmail.com
HNSJ, 2023, 4(7); https://doi.org/10.53796/hnsj476
Published at 01/07/2023 Accepted at 19/06/2023
Abstract
This paper is about the use of data mining tools to predict student grades. In this work, the python language was used to perform classification algorithms and obtain a number of results, including: data mining and prediction in particular helps in decision making based on expected future estimates, continued prediction systems in the context of a clear, sophisticated, integrated system that provides accuracy and contributes to the development and improvement of student grades the use of data mining techniques in the discovery of knowledge contributes significantly to the improvement of educational outcomes of students, this paper found the performance of the naive bayes algorithm is better than the k-nearest neighbor algorithm based on the results analysis, the accuracy of the naïve bayes algorithm reached 87%. and the accuracy of the k-nearest neighbor algorithm reaches 68%.
Key Words: Data mining, Prediction, Discovery of knowledge , naïve bayes algorithm, K-Nearest Neighbor algorithm.
- Introduction
In fact, the current years are characterized by the Internet and the digital economy with a huge amount of data that has made it impossible for analysts to extract meaningful information using traditional methods. Therefore, it has become necessary to use different techniques for data mining. Data mining combines conventional methods of data analysis with complex algorithms to extract useful and accurate information from a huge amount of unused data, which can later be used to predict future events.
Data mining techniques focus on making future predictions and discovering behavior and trends so that the right decisions can be made in a timely manner knowledge discovery in Databases, constantly abbreviated as KDD, generally involves more than data mining. The process of knowledge discovery includes six phases: Data selection, data cleaning, data enrichment, data transformation or encoding, data mining, and reporting and displaying the discovered information. The objectives of data mining can be divided into the following classes: Prediction, Identification, Classification, and Optimization [2].Moreover, data mining is an interdisciplinary field that benefits from the study of numerous areas, including database technology, artificial intelligence, machine learning, neural networks, statistics and pattern recognition, knowledge-based systems, knowledge acquisition, information retrieval, high-performance computing, image and signal processing, and the analysis of spatial data and visual data that depend entirely on visual perception [1].
In addition, data mining is used for various purposes, for example in education. The goal is to better understand how students learn and to identify the conditions under which they learn in order to improve educational outcomes and to gain insights into and explain educational phenomena [11]. In this paper, we will use data mining tools to help predict student grades. We will use the Python language to perform classification algorithms.
Section 2 presents the method and materials, and Section 3 presents the results and experiments. Section 4 concludes this paper.
- Method and Materials
In this work, students’ grades were predicted by data mining using Naïve Bayes and k-Nearest Neighbor classification algorithms, where the classification is done in two stages. The first stage is the learning process or training a set of grades (training set) and the second stage is the process of classification will be done comparing the results from applying the algorithms, we used the Python language to program the algorithms.
2.1 Naïve Bayes Algorithm
Naive Bayes is a classification method based on Bayes’ theory and the independent assumption of characteristic conditions. For a given training data set, first learn the joint input/output probability distribution based on the independent hypothesis of feature conditions; Then based on this model, for the given input x x, using Bayes’ theorem to find the output with the largest subsequent probability y y
Naive Bayes algorithm works understand it using an example. in the following we have a training data set of weather and corresponding target variable (possibilities of playing). Now, we need to classify whether players will play or not play, this possibility based on weather condition. Let’s apply the following steps to perform it.
Step 1: Transform data set into a frequency table
Step 2: Produce likelihood table by chancing the probabilities such Overcast probability = 0.29 and probability of playing is 0.64.
Step 3: using Naive Bayesian equation for calculating the posterior probability for each class. The class with the highest posterior probability is the outcome of prediction.[3]
- P(A|B): Posterior probability of class (target) given predictor (attributes).
- P(A): Refer to prior probability of class.
- P(B|A): Refer to likelihood which is the probability of predictor given class.
- P(B): Prior probability of predictor.

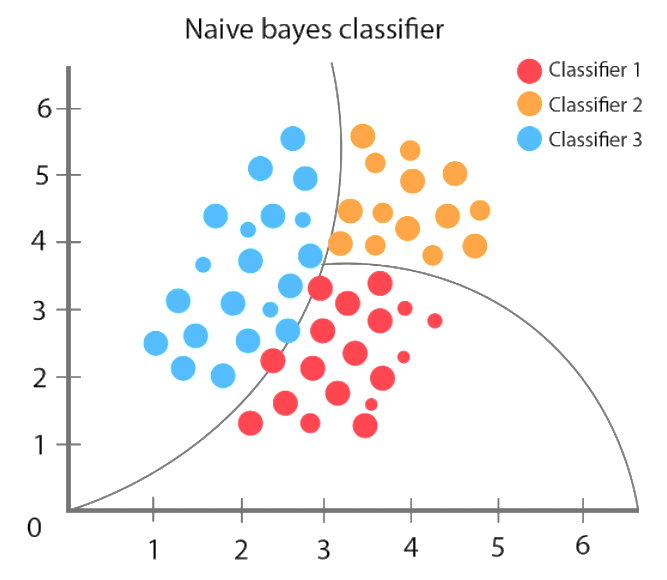
Fig 1. Naïve Bayes Classifier
-
- k-Nearest Neighbor Algorithm
Nearest Neighbors is one of the Predictive Model algorithms. It does not need to learn complex mathematical equations, but only needs two things to be available in the Dataset:
- A way to calculate the distance between data
- Hypothetical realization that data close to each other are similar and far from each other are not similar[4]
Most of the techniques that are used in prediction algorithms Predictive Model look at the data set as a whole in order to know the data patterns, but Nearest Neighbors on the other hand neglect a lot of information, as predictions are made for each new point (a new instance) depending only on the number of points close to it.
Algorithm steps:
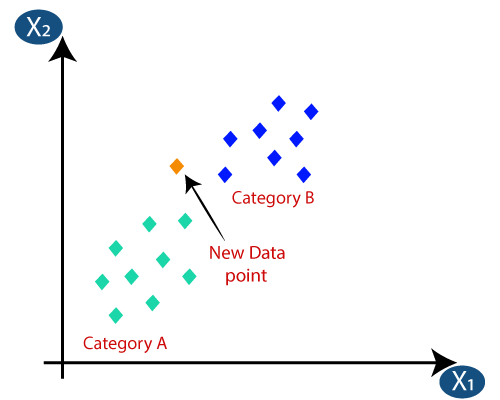
1- We determine the value of the variable k that expresses the number of neighbors
2- Calculate the value of the distance between the new example and the examples in the dataset
3- We arrange the examples to get the adjacent ones, depending on the minimum distance that was calculated in the previous step, and we take from them the number of k adjacent
4- Define the class for the neighbors
5- The class that has the majority of the neighbors is the expected class for this example[5]

Fig 2. K-Nearest Neighbor Algorithm
-
- Prediction Framework
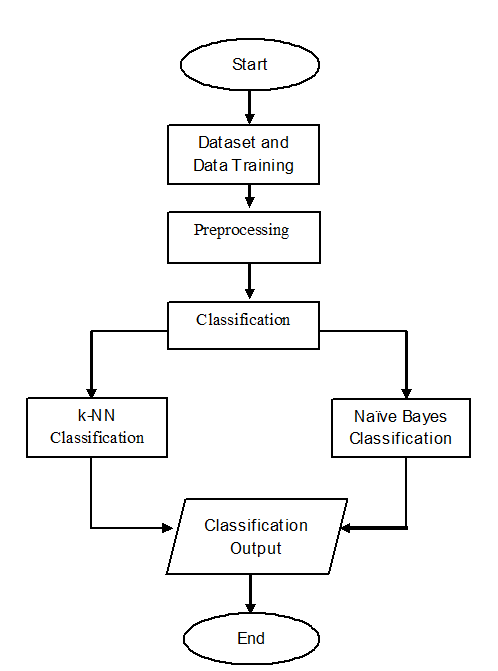
This part explains the steps using Naïve Bayes and k-Nearest Neighbor Fig 3 shows the steps of the processes

Fig 3. Steps of Processes
- Dataset and Data Training
The dataset used for many students that have been obtained in the last three years, all of the training data have stored in information system by using Data Base Management System DBMS
- Preprocessing
Preprocessing in this stage that the information prepared for the classification stage. in this stage using some of the tokenization and calculation [6].
- Classification
This Paper will compare the execution of the naïve bayes and k-nearest neighbor algorithm based on student grade, this will be done based on the grades of a number of students in different courses, as the results appear in Table 1 and Table 2
Naive Bayes is basic probabilistic classification algorithm. This algorithm will be calculating a set
of probabilities using including up the recurrence and combination of values from a given dataset. the naive bayes algorithm considers all attributes in each category that don’t have a dependency on each other nearest neighbor is to locate the nearest separation between the information to be assessed with k neighbors in the training data [7].the distance calculation uses a cosine similarity algorithm. the next step is sorting the distance based on the smallest (closest) value to the largest (farthest). then determine the number of neighbors (k values) that want to be used as a reference for the classification process [8].
- Results and experiments
Table 1 shows the test data generated by the naïve bayes algorithm. This table consists of a column (Predicted Grade) that is used for the prediction result. This prediction is compared with the column (Real Grade) to calculate the accuracy.
| NO | Real Grade | Predicted Grade | comment |
| 1 | Excellent | Excellent | True |
| 2 | Very good | Very good | True |
| 3 | Pass | Good | False |
| 4 | Very good | Very good | True |
| 5 | Fail | Fail | True |
| 6 | Fail | Pass | False |
| 7 | Good | Good | True |
| 8 | Excellent | Excellent | True |
| 9 | Good | Good | True |
| 10 | Pass | Pass | True |
Table 1. Naive Bayes classification
Table 2 shows the test data generated with the K-nearest neighbor algorithm. This table consists of a column (Predicted Grade) that is used for the prediction result. This prediction is compared with the column (Real Grade) to calculate the accuracy.
| NO | Real Grade | Predicted Grade | comment |
| 1 | Excellent | Very good | False |
| 2 | Very good | Good | False |
| 3 | Pass | Pass | True |
| 4 | Very good | Very good | True |
| 5 | Fail | Good | False |
| 6 | Fail | Pass | False |
| 7 | Good | Good | True |
| 8 | Excellent | Excellent | True |
| 9 | Good | Good | True |
| 10 | Pass | Pass | True |
Table 2. K-nearest neighbor classification
Table 3 and Fig 4 described the number of results based on testing data for each grade using the Confusion Matrix when using the Naive Bayes classification
| Input model | Output model | |||||
| Type of degree | Number of degrees | Excellent | Very good | Good | Pass | Fail |
| Excellent | 50 | 44 | 6 | 0 | 0 | 0 |
| Very good | 50 | 2 | 43 | 5 | 0 | 0 |
| Good | 50 | 0 | 3 | 42 | 5 | 0 |
| Pass | 50 | 0 | 0 | 3 | 45 | 2 |
| Fail | 50 | 0 | 0 | 3 | 4 | 43 |
Table 3. Confusion matrix of naive bayes
Fig 4. Confusion chart of naive bayes
Table 4 and Fig 5 described the number of results based on testing data for each grade using Confusion Matrix when using K-nearest neighbor classification
| Input model | Output model | |||||
| Type of degree | Number of degrees | Excellent | Very good | Good | Pass | Fail |
| Excellent | 50 | 36 | 10 | 4 | 0 | 0 |
| Very good | 50 | 4 | 35 | 11 | 0 | 0 |
| Good | 50 | 0 | 7 | 33 | 10 | 0 |
| Pass | 50 | 0 | 2 | 5 | 34 | 9 |
| Fail | 50 | 0 | 0 | 8 | 9 | 33 |
Table 4. Confusion matrix of k-nearest neighbor
Fig 5. Confusion chart of k-nearest neighbor
Based on 50 grades that have been tested, the results of the calculation of the accuracy and error of each algorithm are obtained. The results of each algorithm are shown in Table 6.
| Algorithm | Accuracy | Error |
| Naive Bayes | 87 % | 13 % |
| k-Nearest Neighbor | 68 % | 32 % |
Table 5. Comparison of performance
- Conclusion
In this paper, a model was developed that can be used to predict student grades. This was done based on classification algorithms between Naïve Bayes and k-Nearest Neighbor, after applying the Naive Bayes and k-Nearest Neighbor algorithms to classify student grades, we found that the performance of the Naive Bayes algorithm is better than that of the k-Nearest Neighbor algorithm. data mining and prediction help in decision making and reduce the burden of future estimates that depend on the prediction results. We can improve the overall quality and development potential through classification, data mining is one of the most efficient methods for analyzing and compiling data and achieving correlations that increase predictability and provide the best possible targets for knowledge exploration.
REFERENCES
[1] Yousif Elfatih Yousif, “Weather Prediction System Using KNN Classification Algorithm “, European Journal of Information Technologies and Computer Science, Vol 2, Issue 1,2021
[2] J. Han, M. Kamber and J. Pei, Data Mining: Concepts and Techniques, 3rd Edition, Elsevier (The Morgan Kaufmann), 2011
[3] S. Neelamegam and E. Dharmaraj, “Classification Algorithm in Datamining: An Overview”, International Journal of P2P Network trends & technology, vol. 4, no. 8, Sep 2013.
[4] W. Gao, S. Oh and P. Viswanath, “Demystifying Fixed $K$ -Nearest Neighbor Information Estimators,” IEEE Transactions On Information Theory, vol. 64, no. 8, pp. 5629-5661, 2018.
[5] S. Pambudi, R. Agung, and M. S. Mubarok, “Multi-Label Classification of Indonesian News Topics Using Pseudo Nearest Neighbor Rule,” Journal of Physics: Conference Series, vol. 1192, no. 1, 2019, Art. no. 012031.
[6] B. K. Francis, and S. S. Babu, “Predicting Academic Performance of Students Using A Hybrid Data Mining Approach,” Journal of Medical Systems, vol. 43, no. 6, pp. 1-15, 2019, Art. no. 162
[7] O. A. O and A. D. A, “A Data Mining System for Predicting University Student’s Graduation Grades Using ID3 Decision Tree Algorithm,” Journal of Computer Science and Information Technology, pp. 2334-2374, 2014.
[8] K. F.-R. Liu and J.-S. Chen, “Prediction and Assessment of Student Learning Outcomes in Calculus,” in International Conference on Computer Research and Development (ICCRD), Shanghai, 2011.
[9] S.K. Yadav, B. Bharadwaj and S. Pal, “Data mining applications: A comparative study for predicting student’s performance”, International Journal of Innovative Technology and Creative Engineering, vol. 1, no. 12, pp. 13-19, 2011.
[10] Witten IH, Frank E. Data Mining Practical Machine Learning Tools and Techniques. 2015.
[11] Algarni, Abdulmohsen. “Data mining in education.” International Journal of Advanced Computer Science and Applications 7.6 (2016).
