BOUABID Noureddine1 – GHAZI Abdelkhalek2
PhD student at, Soils, environment, development Laboratory, Faculty of Human and Social Sciences, Ibn Tofail University, Kénitra.Morrocco . Bouabidnoureddine@uit.ac.ma
2 University Professor . Soils, Environment and Development Laboratory, Faculty of Human and Social Sciences, Ibn Tofail University, Kénitra-Morrocco. Aghhazi@hotmail.com
HNSJ, 2024, 5(1); https://doi.org/10.53796/hnsj51/4
Published at 01/01/2024 Accepted at 05/12/2023
Abstract
According to Article 1 of the United Nations Convention to Combat Desertification [Paris, 1994], desertification means the degradation of land in arid, semi-arid, dry and sub-humid areas as a result of various factors, including climate change and human activities. In addition to the threat of desertification to the population’s way of life, this phenomenon remains an obstacle to development, it also leads to destroying water and soil resources, this in return leads to escalating rate of migration. As a result, both social and economic development are thwarted.
Key Words: Figuig- Medalus- geographic information systems- desertification.
1.1: Geographic data:
Figuig is located on the Algerian-Moroccan border, 380 kilometers east of Errachidia and 376 kilometers south of the capital of the Oriental region Oujda. Oujda and Figuig are linked by national road 17, which crosses middle of Bouarfa city.Figuig is 100km away from Bouarfa city. Figuig stand in the middle of the Eastern High Atlas and the Saharan Atlas forming the northern limit of the date palm zone(figure 1)
1-2 The Algerian-Moroccan borders:
One of the elements that deeply distinguishes the Figuig oasis is the Moroccan-Algerian border. These borders were established under the Lalla Maghnia Agreement on 18th March, 1845. These borderlines, encircle the city of Figuig Oasis from the north and east, is in the form of a ring from the Zouzfana Valley, and to the the hills of the Milias and Zanaga mountains in the south. This border path then separates the Morrocan oasis town of Figuig, Moroccan, from the Algerian Ksar Beni Ounif, which is on the other side of the Zanaga mountain pass in Algeria. The geographical position of Figuig is dilemma due to the political situation related to the closure of the Morrocan-Algerian borders, there is a stork difference between the northen region which are considerate more active economically and the southern region which suffered from economic recession and intense emigration. This statuesque had a major urban impact in light of the abandonment of ksars, which are considerated an important intogible heritage of the area. Therefore, residents in such areas must rely more on groundwater resources from for their survival.
Figure 1 : Administrative division of the field of study.
Source: personal workArcGis10.1,2021
2- The problem :
Studying the borderline areas dictates a thorough knowledge of its reality and its challenges. So as accurately address any incidents phenomena that may threat the safety and security of neighboring areas. A number of negative phenomena emerge at the border zones. These negative phenomena due to a number of factors such as lack of well-defined development policies, poverty, smuggling, immigration… and dynamic relationship in which poverty.
3- Objective :
Trying to clarify and understand the factors that contribute to the Figuig Oasis’ depopulation caused by desertification, this article will take this issue seriously. Using geographic information systems and specific technologies [MEDALUS], the study aims to assess the sensitivity of desertification and the degradation of environmental systems.
Territorial approaches to development have emerged as a viable solution to comprehending the changes brought about by globalization.
Given the current understanding of territorial communities, where territorial organization is a crucial component of integrated and participatory public policy, and helps to establish local democracy and shape local development, the idea of territorial space has become firmly ingrained in these contexts.
- Previous studies :
- The issue of the presence of hydrogen and groundwater in the Figuig oasis region has been a source of great concern to researchers and scholars. Ben chrifa and Herbert Popp [1987-1988] investigated this issue with the support of the German Society for Scientific Research. Research [GI-D.FG] and Mohammed V University in Rabat. According to their conclusion, the groundwater that feeds the oasis in the city of Figuig comes from the Atlas Mountains, not rainwater, The researchers highlighted. This conclusion that occurred and brought it to the forefront of attention. With the exception of kasr[1] al-Hamam, al-Fouqani, and al-Tahtani, the palm groves in the Figuig ksars is now at risk due of being contaminated with Fusarium oxysporum disease.
- Abdel Hakim’s study [2014]: is an attempt to understand the movement of groundwater within the subterranean undergroundwater of the oasis of the city of Figuig in the eastern High Atlas. his study attempted to provide an explanation of the geological layers, which are interspersed with fractures from west to east, as well as to provide explanation of the geophysical characteristics such as ranges Resistance, gravitational tension, and conductivity that characterize groundwater reservoirs in the Figuig oasis.
- Al-Hasnawi’s study [2018] came in the context of preserving the biological diversity of palm trees and at the same time promoting and publicizing the species present in the oasis of the city of Figuig. The objectives of the study were to develop an evaluation of the dominant varieties of dates through physical and chemical analyzes [pH-ratio Water – Color – Sugars], as some results showed the presence of a large percentage of fiber in certain types of dates, especially AZIZA dates, and in their ability to retain water.
5-Means and methods:
Desertification sensitivity was assessed in the oasis city of Figuig, using the [MEDALUS[2]] approach. Impact is captured through a set of processes describing the quality of climate [IQC], soil [IQS], vegetation [IQV] and; The Human Intervention Index [IQSA] is sub-indices according to the following equation:
ISD = (IQC.IQS.IQV.IQSA)
A good deal of information related to the criteria involved in the phenomenon of desertification are adopted, starting with the data available in the field of study and integrated into the geographical information system, in addition to satellite images [LAND SAT 8] and digital terrain models [STRM 1].(Figure 2)
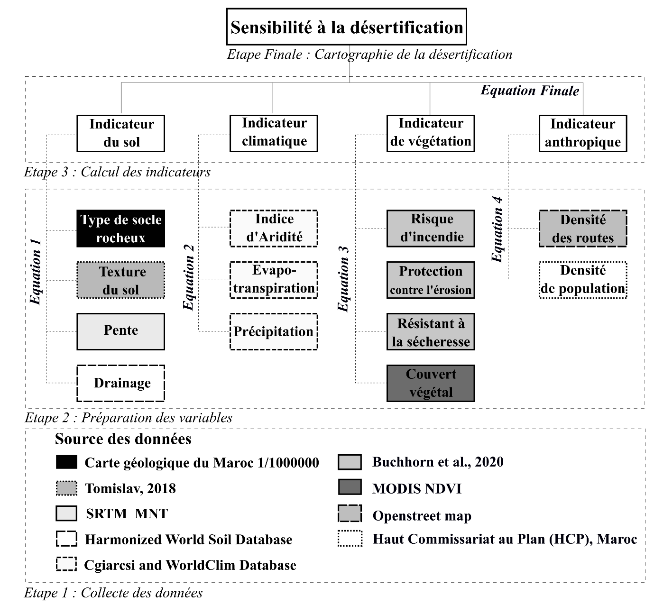
Figure 2: Steps followed to calculate the desertification sensitivity index.
5-1 – Climate Quality: [IQC]
Climate quality is evaluated using criteria that affect water availability for plants through the transpiration index, aridity, and total precipitation. The climate quality index is calculated using the following equation.
Climate quality index =(Aridité x Evapotranspiration x Précipitation)^ (1/3)
5-2 Soil Quality Index [IQS]
The desertification process is characterized by a group of sub-elements that evaluate the condition of soil in terms of soil quality, as represented by this indicator. It refers to the physical properties of the soil and the qualities of the parent rock, slope, the exchange rate and inversely. The climate quality index is determined by applying the equation represented by the asterisk in the equation:
Soil quality index = (Type of soil surface x Texture of soil x Pente x Drainage)^(1/4).
5-3 Vegetation Quality Index: [IQV]
This average measures the weighted values of different indicators related to fire risk, drought resistance, protection against erosion, and vegetation cover, with a focus on fire risk, drought resistance, and vegetation cover. The equation that is used to calculate the climate quality index is expressed as a square root of the climate quality index.
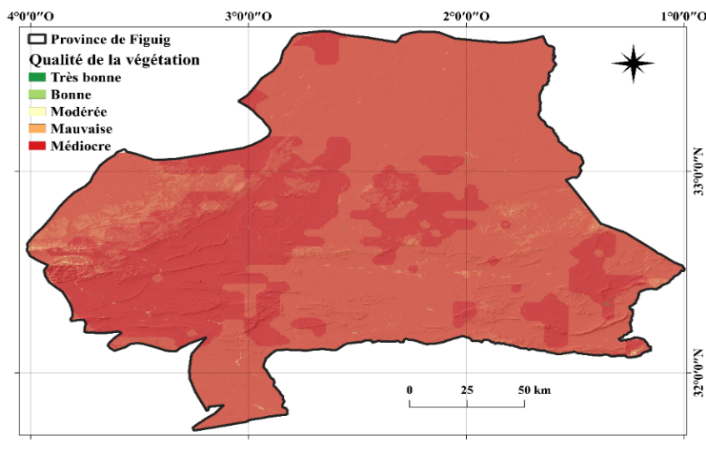
Vegetation quality index = (Fire risk x Drought resistance x Plant cover x Erosion protection)^(1/4).
5-4 Index of Quality of Human Activities: [IQSA].
By evaluating the volume of land use, the amount of humanitarian aid, and policies implemented to decrease desertification in the area that is being investigated, the climate quality index is calculated as: 1. Climate quality Index: The equation below is not indicative and should not include all available information.
Anthropic quality index = (Density of routes x Density of population)^(1/2)
6- Discussions:
Soil erosion and desertification are key factors in the occurrence of less than 250 mm of annual precipitation in Figuig, an oasis city.
A poor quality climate (75.5%) is the dominant variable in the study area over most of the interior regions bordering the Moroccan-Algerian border, followed by a poor quality climate (20.9%) and a moderate quality climate (3.34%). The overall temperature range of 0.1-0.16% is attributed to good to good climate quality. The above statistics are supported by ] Table 1[ and (Figure 3 and Figure4)
| Table :1- Climate Quality: [IQC] | ||
| Raw values | Scores | Area per square meter 2 |
| < 1,00 | excellent | 56,0151 |
| 1,12 | Good | 22,7889 |
| 1,24 | Average | 1153,0674 |
| 1,37 | Bad | 26077,5837 |
| > 1,49 | Weak | 7227,9522 |
Source: Methodology of MEDALUS
منهجية
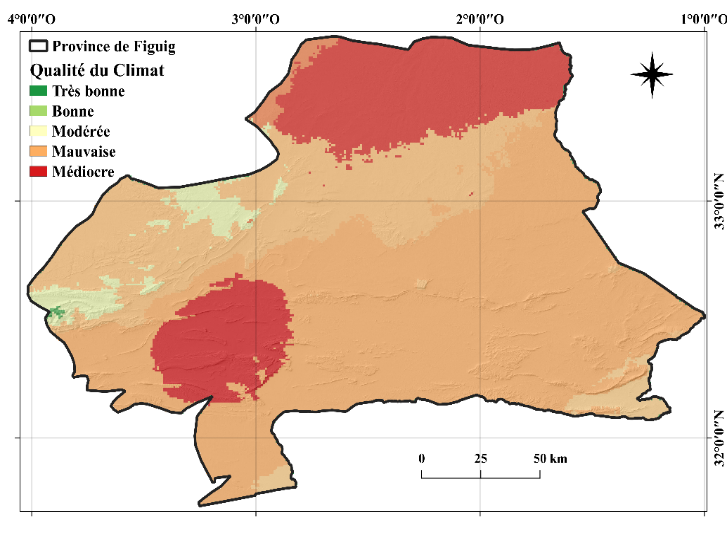
Figure 4: Climate Quality In The Province Of Figuig, According To The Methodology [MEDALUS]
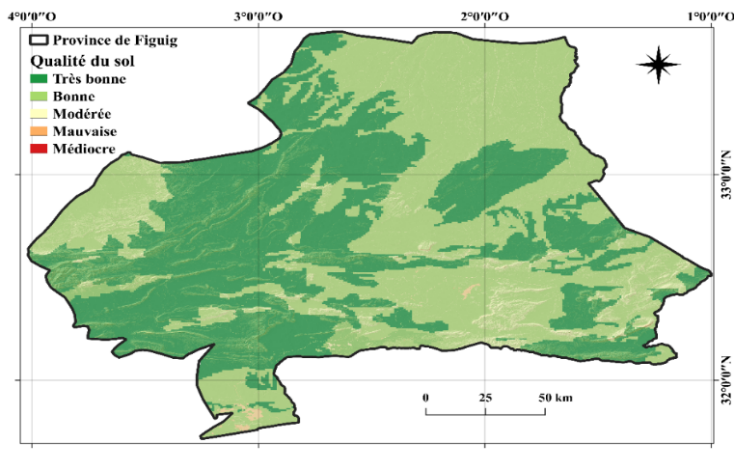
Soil quality maps indicates ( Figure 5 )that 36.01% of the soil is excellent, and 13.34% is considered good ( Table 2). Figuig, an oasis city, has around 50.20% of its area covered by soil that is classified as medium quality, while the remaining areas are occupied by poor soil classified as well. ( Figure 4)
The lack of areas of good quality can be explained by the dominance of rocks as well as poor drainage in the soil of the area [figure 7]. It is also noted that the vegetation cover is of poor quality and covers approximately 99.72%. In contrast, vegetation cover of poor quality represents approximately 0.27%. While areas with excellent vegetation cover are limited to less than 1%, where there are palm groves and their extensions. [Table 3] This indicator shows that the nature of the vegetation cover does not provide protection from desertification.
| Table :2 Soil Quality | ||
| Raw values | Scores | Area per square meter 2 |
| < 1,00 | excellent | 12424,3767 |
| 1,17 | good | 4603,8366 |
| 1,34 | middle | 17319,1473 |
| 1,51 | bad | 155,1546 |
| > 1.68 | weak | 0,2007 |
| Table 3 : Quality of vegetation | ||
| Raw values | Scores | Area per square meter 2
Table no2: Soil quality |
| < 1,00 | Excellent | 2,106 |
| 1,17 | Good | 0 |
| 1,33 | Average | 0 |
| 1,50 | Bad | 65,5065 |
| > 1.66 | Weak | 24226,0614 |
Source: Methodology of MEDALUS
Source: Methodology of MEDALUS
منهجية
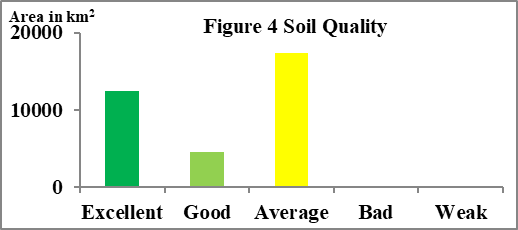
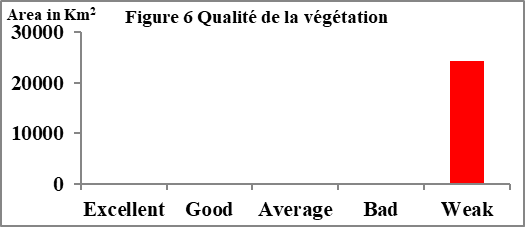
Source: Methodology of MEDALUS


| Table 4 : Quality of human intervention | ||
| Raw values | Grades | Area in square meters2 |
| < 1,00 | Excellent | 14756,4243 |
| 1,14 | Good | 19197,5949 |
| 1,27 | Average | 307,6524 |
| 1,41 | Bad | 173,9988 |
| > 1.55 | Weak | 0,01 |
Source: Methodology [MEDALUS]
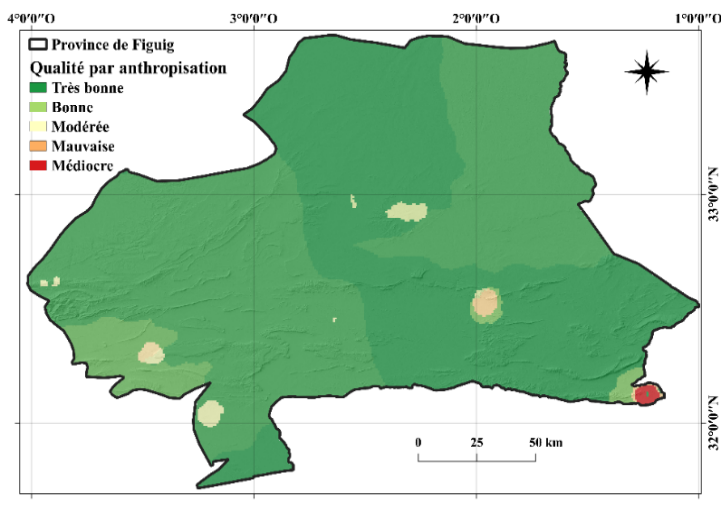
Figure 8: Human Intervention in Province of Figuig according to the methodology [MEDALUS]
For instance, we can further divide human intervention into two areas: area of high quality in the field at approximately 42.85% and area of high quality at around 55.75%, which are representatives of the agricultural development projects developed by the population. The discussion pertains to agricultural extensions that are being developed to evaluate palm plantations in the Al-Arja region and Tesarifine Plain.
7- Results :
The desertification sensitivity map was created using the methodology [MEDALUS], which employed two indicators – a base indicator and a subsidiary indicator – and a methodology that revealed the existence of deserts that are particularly susceptible to desertification, making up 85.99% of the area of study, possibly due to lack of vegetation cover and low soil quality.
Desertification occurs in areas where the sensitivity to it may be high with high desertification levels of around 8.18% of land used for intensive activities may be due to the loss of balance associated with pastoral activities, where the exploitation of wild and vulnerable plant resources can result in an imbalanced ecosystem and a loss of biodiversity, as can the increasing exploitation of the underground water and the phenomenon of excessive drought.
Climate factors such as floods, drought, and strong winds that contribute to faster evaporation and, sometimes, desertification are a concern, affecting approximately 5.62% of areas that are most prone to desertification, which may include significant sites where sand can be transported and even deposited, such as ksars, roads, agricultural lands, irrigation infrastructure, or intensive application of fertilizers.
Desertification sensitivity index was introduced to the sensitivity index category, allowing for the creation of a map that can be utilized as a decision-making tool for constructing a region and devising strategies for tackling desertification [Figure 9] as a priority.
| Table 5 Desertification sensitivity index | ||
| Raw values | Degrees of sensitivity | Area in square meters2 |
| < 1,00 | not available | 74,736 |
| 1.00 – 1.10 | Weak | 0 |
| 1.10 – 1.20 | Moderate | 1927,4769 |
| 1.20 – 1.30 | Strong | 29515,7862 |
| > 1,30 | very strong | 2806,8498 |
Source: Methodology [MEDALUS]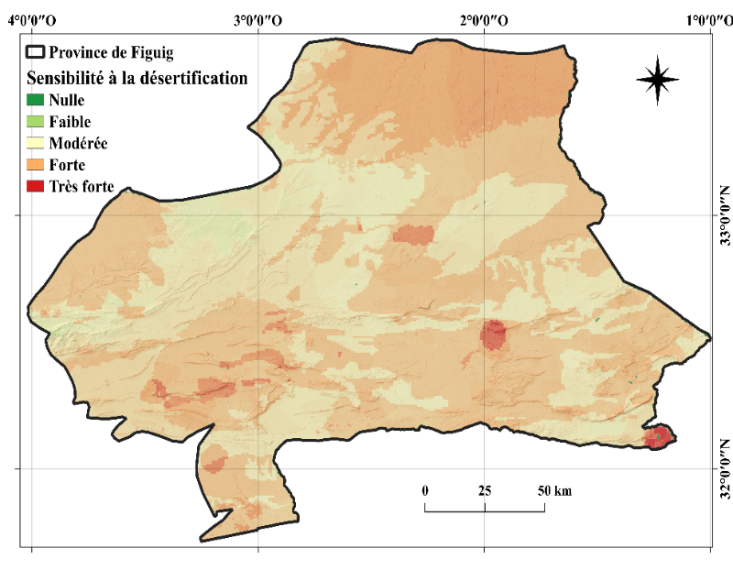
.
Figure 9: Desertification sensitivity index in Province of Figuig, according to the [MEDALUS] methodology
Referance :
Buchhorn, M. ; Lesiv, M. ; Tsendbazar, N. – E. ; Herold, M. ; Bertels, L. ; Smets, B. Copernicus Global Land Cover Layers — Collection 2. Remote Sensing 2020, 12, Volume 108, 1044. DOI 10.3390/rs120610 Lcviewer.vito.be
Buchhorn, M. ; Lesiv, M. ; Tsendbazar, N. – E. ; Herold, M. ; Bertels, L. ; Smets, B. Copernicus Global Land Cover Layers — Collection 2. Remote Sensing 2020, 12, Volume 108, 1044. DOI 10.3390/rs120610 Lcviewer.vito.be
Buchhorn, M. ; Lesiv, M. ; Tsendbazar, N. – E. ; Herold, M. ; Bertels, L. ; Smets, B. Copernicus Global Land Cover Layers — Collection 2. Remote Sensing 2020, 12, Volume 108, 1044. DOI 10.3390/rs120610 Lcviewer.vito.be.
JILALI, A. (2014). contribution à la compréhension du fonctionnement hydrodynamique de la nappe souterraine de l’oasis de Figuig (Thèse de doctorat). Faculté des Sciences. Centre d’étude doctorale Sciences et techniques. Université Mohammed le Premier. Oujda.
Web site :
SRTM 1-arc second from Earthexplorer.usgs.gov
Carte géologique du Maroc 1:1000000
Haut Commissariat au Plan (HCP), Maroc HCP.ma
Openstreet map dataset
WorldClim WorldClim.org
https://cgiarcsi.community/
WorldClim WorldClim.org
SRTM 1-arc second from Earthexplorer.usgs.gov
MODIS NDVI Earthexplorer.usgs.gov
- The ksar is often composed of rows of houses, each of which is inhabited by families who share a close and similar bond of closeness and common lifestyle, often of tribal descent, and are connected by numerous social bonds. In 1959, Ibn Khaldun described the architecture of the Figig Oasis as a “palatial ksar” close to each other, surrounded by the remnants of the fate of a local Bedouin urbanism confined to a single region. In its absolute form, a political and social entity unites different social groups based on traditions, family relationships, and economic and social interests. The precise and repeated features found in neighboring buildings and roads (including walls, entryways, and a mosque, a Qur’anic book, and a shrine, as well as the buildings and roads that form the urban fabric of the palace where the collective system is formed) determine the ksars shape. ↑
-
A European-supported project to assess, model and understand the phenomenon of desertification, which is increasingly affecting the Mediterranean region. According to this approach, the degree of desertification sensitivity is determined through the ISD index. www.cru.uea.ac.uk/project/medalus. ↑
