Lara Yousef Al-Jaafreh Prof. Dr. Mohammad Jamil Al-Qaralleh
1 Civil Engineer, Greater Amman Municipality, Jordan, Email: lara-jaafreh1@outlook.com2 Department of Geography, Faculty of Social Sciences, Muta’h University, Jordan, Email: mqaralleh@mutah.edu.jo
HNSJ, 2024, 5(1); https://doi.org/10.53796/hnsj51/6
Download
Published at 01/01/2024 Accepted at 05/12/2023
Abstract
This study was conducted in Al-Salt city, Jordan, to assess and analyze the changes in land use and land cover from 2004 to 2020 and model the changes for the years 2030 and 2050.
A Supervised classification was applied based on four satellite images: Landsat-5 TM (2004), Landsat-5 Tm (2009), Landsat-8 OLI-TIRS (2014), and Landsat-8 OLI-TIRS (2020). An accuracy assessment was applied since the aim is to characterize the LU/LC changes. Due to the absence of field truth data, the error matrix for accuracy is employed by Google Earth Pro based on the training samples. For the simulation of land use and land cover and to predict future land use in the years 2030 and 2050, the CA-Markov model was implemented. Multiple factors have been taken into consideration that influence the modeling of LU/LC maps, such as DEM, slope, population, and road network.
The results demonstrate that urban areas are expanding and will continue to expand in 2030 and 2050, the area around the central part of Al-Salt city is expected to witness a significant expansion of urban areas. Urban area expansion is primarily caused by increased population growth rates, large numbers of immigrants, and various socioeconomic changes.
Key Words: classification, CA-Markov, simulation.
عنوان البحث
التنبؤ المستقبلي للاستعمال الأرضي / الغطاء الأرضي في مدينة السلط باستخدام CA- Markov Model
لارا يوسف خليف الجعافره1 أ.د محمد جميل احمد القراله2
1 مهندس مدني, امانة عمان الكبرى, الاردن, بريد إلكتروني: lara-jaafreh1@outlook.com
2 قسم الجغرافيا, كلية العلوم الاجتماعية, جامعة مؤته, الاردن, بريد إلكتروني: mqaralleh@mutah.edu.jo
HNSJ, 2024, 5(1); https://doi.org/10.53796/hnsj51/6
تاريخ النشر: 01/01/2023م تاريخ القبول: 05/12/2023م
المستخلص
اجريت هذه الدراسة في مدينة السلط، الأرْدن، لتقييم وتحليل التغيرات في استعمالات الأراضي والغطاء الأرضي للفترة (2004-2020)، ونمذجة التغيرات المتوقعه لعامي 2030 و 2050 .
استخدم التصنيف الخاضع للإشراف بناءً على أربع مرئيات فضائية وهي: Landsat-5 TM (2004)، Landsat-5 Tm(2009)، Landsat-8 OLI-TIRS (2014)، Landsat-8 OLI-TIRS (2020). طبقت تقييم الدِّقَّة نظرًا لأن الهدف هو تحديد التغيرات في خرائط استعمالات الأراضي و الغطاء الأرضي. نظرًا لعدم توفر بيانات ميدانية, اعتمدت مصفوفة الخطأ للدقة من قبل Google Earth Pro بناءً على عينات التدريب.
ولمحاكاة استعمالات الأراضي و الغطاء الأرضي والتنبؤ المستقبلي لعامي 2030 و 2050 ,استخدم CA-Markov Model. وأخذ بعين الاعتبار العوامل التي تؤثر على التغيرات في أنواع الأراضي مثل: نموذج الارتفاعات الرقمي، والانحدار، وازدياد السكان، وشبكة الطرق. وقد أظهرت النتائج أن المناطق الحضرية آخذة في التوسع وستستمر في التوسع في عامي 2030، و2050. ومن المتوقع أن تشهد المنطقة المحيطة بالجزء المركزي من مدينة السلط توسعًا كبيرًا في المناطق الحضرية، ويرجع السبب الرئيس لتوسع المناطق الحضرية إلى زيادة معدل النمو السكاني والأعداد الكبيرة من المهاجرين، فضلاً عن التغيرات الاجتماعية والاقتصادية المختلفة.
الكلمات المفتاحية: التصنيف، CA-Markov، المحاكاة.
Introduction
Studying land use and land cover detection is considered an important study that has witnessed global interest from researchers and planners. Raising population numbers, the expansion of urban areas on agricultural land, and the irregular use of agricultural land led to the necessity of studying and detecting the changes in land use and land cover. Land cover and land use detection can help increase agricultural production efficiency and protect the environment. It is also regarded as an early warning system and a method of planning. To identify the effects of humans on the environment, scientists have formed the Land Use and Land Cover Change (LU/LC) international organization, which connects the International Geosphere-Biosphere Plan and the International Human Aspects of Global Change Program (Pontius & Chen, 2006).
Scientists are headed to utilize geographic information systems (GIS) and remotely sensed data to plan and organize cities; these technologies assist in interpreting and analyzing various data and facilitate the tasks in front of planners to create spatial databases. Integrating remote sensing, geographic information systems, and land change modeling provides tools for analyzing land use changes, supporting land use planning, and estimating the effects of land use changes. Models can also aid in the investigation of future land use changes under various scenarios. Therefore, using a geographic information system (GIS) and geospatial modeling system such as TerrSet to predict the changing land use and land cover of the study area will help the planners plan the urban growth and study the changes in the study area.
Al-Salt city is one of the Jordanian cities that grew rapidly in population, influencing educational, health, and residential services and the expansion of urban areas on agricultural land, which increased the importance of studying and planning the city. Given the above, the study came to highlight and reveal the changes in land use and land cover in Al-Salt city and to predict future changes in 2030, and 2050.
1.1 Location of study Area
Al-Salt city is located within Al-Balqa governorate. It is an ancient agricultural city in the center of the governorate. It is considered one of the most important settlements in the area between the Jordan Valley and the Eastern Desert. Al-Salt city was considered an important trading link between the Eastern and Western Deserts. It is situated in the Balqa highland about 900 meters above sea level and located between two longitudes (35 º41´0 “E), (35 º48´0 “E), and two latitudes (31 º59´0″ N), (32 º05´30 ” N) figure (1). The city has a total area of 48 square kilometers, accounting for 4% of the Al-Balqa governorate’s 1120 square kilometers total area. The climate is Mediterranean, with rainfall beginning in late October and lasting until the end of April and the summer being dry and hot. The soil types are very productive and sustain diverse natural land cover types. Broad plains, moderate hills, high mountains, and small valleys are among the different types of terrain. (Greater Salt Municipality, 2022(. Al Salt city was established in 1887 and is regarded as Jordan’s most important representative of Ottoman architecture. Al Salt is well-known for its natural views, tourism potential, and agricultural productivity.
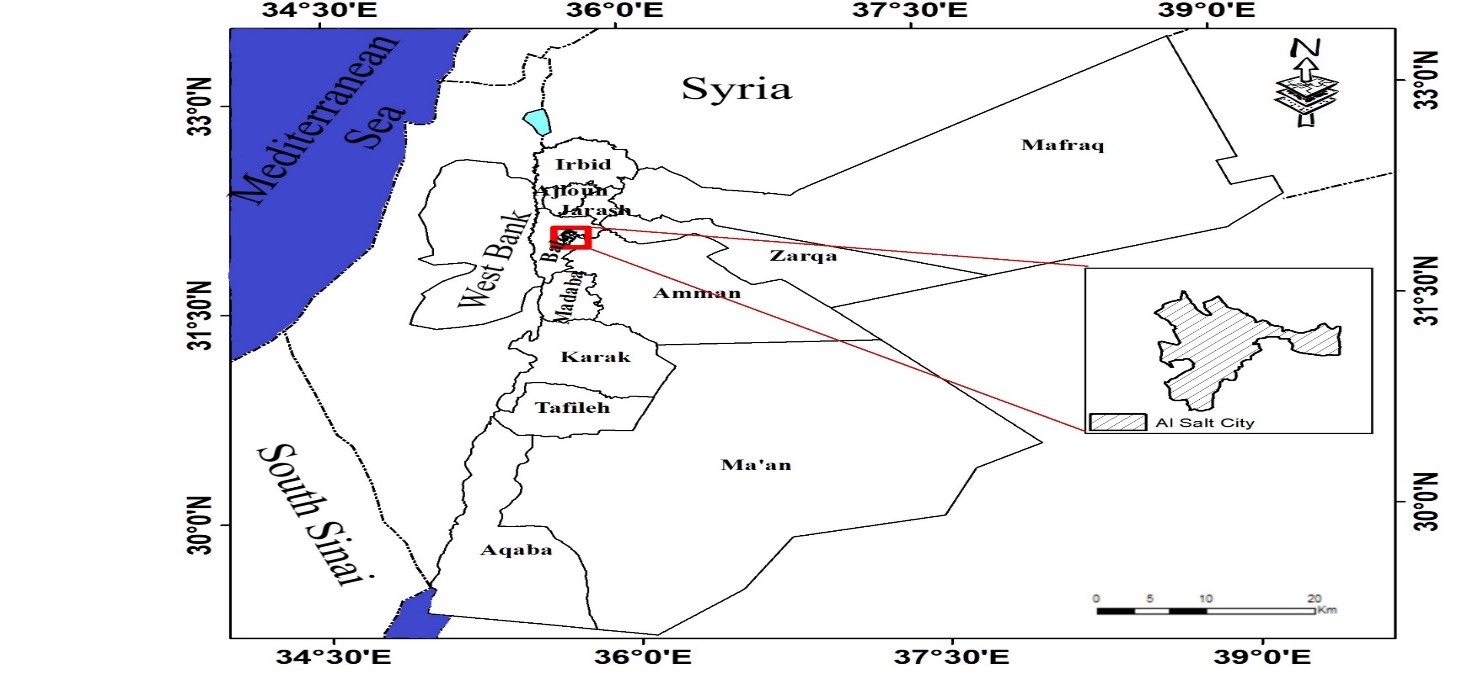 The city is situated on three major hills: Al Salalem, Al Jadah, and Al Qalah, where the city core is located. The three hills intersect, and there are government institutions and committees, as well as a commercial and cultural hub, public service institutions, and marketplaces (Greater Salt Municipality, 2022).
Figure (1): Location of the study Area
Source (Greater Salt Municipality, 2022)
1.2 Problems of the Research
The study area witnessed a significant urban expansion and suffered from population growth; the population in 2004 was approximately 73,000 inhabitants and is estimated to reach over 118,000 inhabitants in 2022. The accelerating population expansion and increasing socio-economic needs in the city have led to an enormous strain on natural resources, which has increased the changes in LU/LC over time without any effective planning.
increasing urban population causes urban sprawl and unlimited challenges in preserving agricultural areas, and forest land. Selecting suitable approaches to plan, organize, measure changes, predict the LU/LC, avoid land misuse, and reduce agricultural land exhaustion is a necessity to organize and plan the city.
1.3 Study questions
The following Researcher questions were developed to address the stated problem:
1-What is the nature of land use and land cover changes that occurred during the study periods?
2- What changes will occur in land use and land cover in the predicted maps of 2030 and 2050?
1.4 Objectives Research
1-Quantify and investigate the characteristics of land use and land cover using multi-temporal Landsat imagery for the years 2004, 2009, 2014, and 2020.
2-Predict the future LU/LC in the area in 2030 and 2050 by focusing on the development of the urban area of the study area using the CA-Markov model.
- Methodology
Several steps were utilized in land use/land cover change analysis and modeling in this study, figure (2).
1-Landsat satellite images were utilized to analyze LU/LC changes in Salt city and were downloaded from the USGS website in Geo TIFF format, the images were collected over 16 years (between 2004 and 2020).
2-Pre-processing is applied to Landsat images starting with extracting by mask, which is applied in ArcGIS10.7.1 using the boundary of the study area.
3-Atmospheric and radiometric corrections were applied to Landsat images.
4-To better understand LU/LC types, supervised classification was performed in an ArcGIS10.7.1 environment using the maximum likelihood method. Training samples were collected for specific classes based on prior knowledge of the study area. The accuracy of each image is determined using random sampling.
5-Change detection from 2004 to 2020 was done in the TerrSet software.
6-Predicted LU/LC maps for 2030 and 2050 using the CA-Markov chain model in TerrSet software.
7-The module was validated in TerrSet software by implementing the Kappa Index, and the predicted LU/LC was compared to the digitized LU/LC map to seek similarities between the simulated and real images.
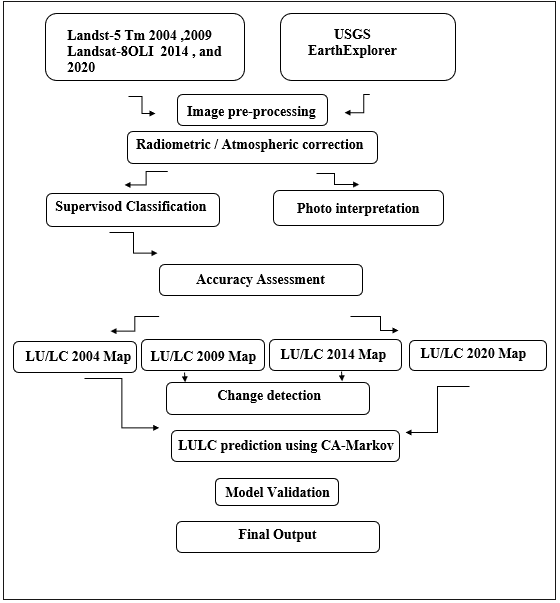
Figure (2): Flowchart of the Study methodology
Source (Author.2023)
2.1 Data required
LU/LC changes can be predicted using multi-temporal land use/cover data, as well as other data sources required for the study’s improvement. Other data sources include.
1-Roads: The main road network of the study area was based on data from Greater Salt Municipality.
2-Euclidean distance for the urban area by using ArcGIS10.7.1.
3-Euclidean distance for the road by using ArcGIS10.7.1.
4-Slope: prepared in ArcGIS 10.7.1.
5-DEM: Digital Elevation Model for the study area with a spatial resolution of 30m from USGS.
2.2 Land Use/Cover Classification
Landsat satellite images are utilized to analyze LU/LC changes in the Salt city The period of collected images is 16 years (2004–2020). ENVI 5.3 and ArcGIS 10.7.1 were used to achieve image classification in a multi-temporal approach and for mapping purposes. Each image was classified using supervised classification, and accuracy assessment was evaluated after defining the region of interest (ROI), which is referred to as training classes. The locations of the training classes were chosen by Landsat Image and Google Earth pro.
2.3 Accuracy Assessment
The accuracy assessment is a determination of the most convenient pixels for the land cover classes. A confusion matrix was used to compare a set of randomly chosen reference points to the classified images to assess the accuracy of the classification. This study used historical high-resolution Google imagery obtained from Google Earth Pro to assess accuracy. Classification accuracy was evaluated using the metrics derived from the error matrices. The kappa coefficient and overall accuracy are two examples of error matrices.
2.4 Modelling of LU/LC changes
The Land Change Modeler implanted in TerrSet Geospatial Monitoring was used to predict future LU/LC for a given year based on classified historical satellite images. The land change modeler determines how factors influence LU/LC changes, how much land cover change occurred between earlier and later LU/LC, and then computes the value of transitions (Leta et al.,2021).
Land use modeling is a simplification of a complex reality whose parameters are expressed using a combination of empirical data and theoretical predictions of the relationships among system components and represents a tool to support and monitor natural resources, which can help decision-makers optimize resource planning and utilization for sustainable rural development. (Verburg, Schot, Dijst, &Veldkamp 2004).
2.4.1 Cellular Automata (CA)
In the CA model, the transition of a cell from one land cover to another is determined by the state of the neighboring cells. This is based on the idea that if a cell is closer to land-cover class ‘A,’ it has a higher probability of changing to land-cover class ‘A,’ rather than land-cover class ‘B.’ As a result, unlike the Markov model, the CA model uses the states of neighboring cells to transition (Adhikari & Southworth, 2012).
2.4.2 Markov Model
The Markov model is a useful tool for simulating LULC changes; a Markov process is one in which the future state of a system can be simulated based on the immediately preceding state. The Markov model will describe the change in LULC from one period to another (Kumar, Radhakrishnan, & Mathew, 2014). Equation (1) explains the formula used to simulate changes in land use:
![]()
Source: Hamad, Balzter, and Kolo, 2018
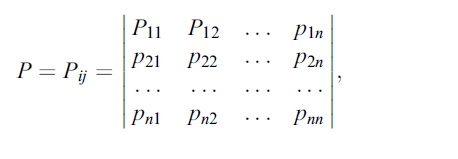 where S (t) demonstrates the status at time t, S (t + 1) demonstrates the status at time (t + 1), and Pij demonstrates the transition probability of the matrix (Hamad, Balzter, & Kolo, 2018). State transition describes the process by which a system changes from one state to another. P stands for the transition probability, which indicates the likelihood that one state will change into another, the expression of the transition probability is illustrated as:
Source: Kumar et al.,2014
P stands for the transition probability from state i to state j, which indicates the likelihood that one state will change into another. According to Kumar et al. (2014), a low transition probability exists near 0 and a high transition probability exists near 1. The Markov chain specifies how much the land changes between the present date and the predicted date. The output of this process is the transition probabilities text file, which records the probability of each land cover class changing to another. The analysis of two different LULC images with different dates using Markov chain modeling yields a transition area matrix and a transition probability matrix (Mishra, Rai, & Mohan, 2014).
2.4.3 CA Markov Model
Cellular Automata and Markov chain combine to give CA-Markov to predict the LULC. One of the foremost commonly used models to model the LULC is CA-Markov, which models both spatial and temporal changes. Besides, the state of a cell relies on the spatial and temporal characteristics of its neighboring cells (Hamad et al., 2018).
2.5 Validation
Kappa indices are commonly used to evaluate the performance of land-use change models in the CA-Markov model. Kappa is a measure of agreement between two sets of categorical data, the simulated land-use map and the actual land-use map. A Kappa value of 1 indicates perfect agreement between the simulated and actual maps, while a value of 0 indicates no agreement. Kappa indices can be used to assess the accuracy of the CA-Markov model in predicting land-use changes.
For estimating the process of predicting an LU/LC map against a reference map, validation is necessary and utilized to calculate the Kappa indices (,, ). The overall proportion correctly classified versus the expected proportion classified is measured by . Measures of spatial accuracy as a result of correct value assignment, the proportion correctly assigned versus the proportion that is correct by chance is measured by . The result of kappa is between 0 and 1; The Value of kappa less than 0.4 indicates less accuracy and consistency, when 0.4 the value of kappa 0.75, the accuracy is reasonable; and when kappa is greater than 0.75 the LU/LC maps have a high level of consistency (Abdulrahman & Ameen,2020).
3 Results
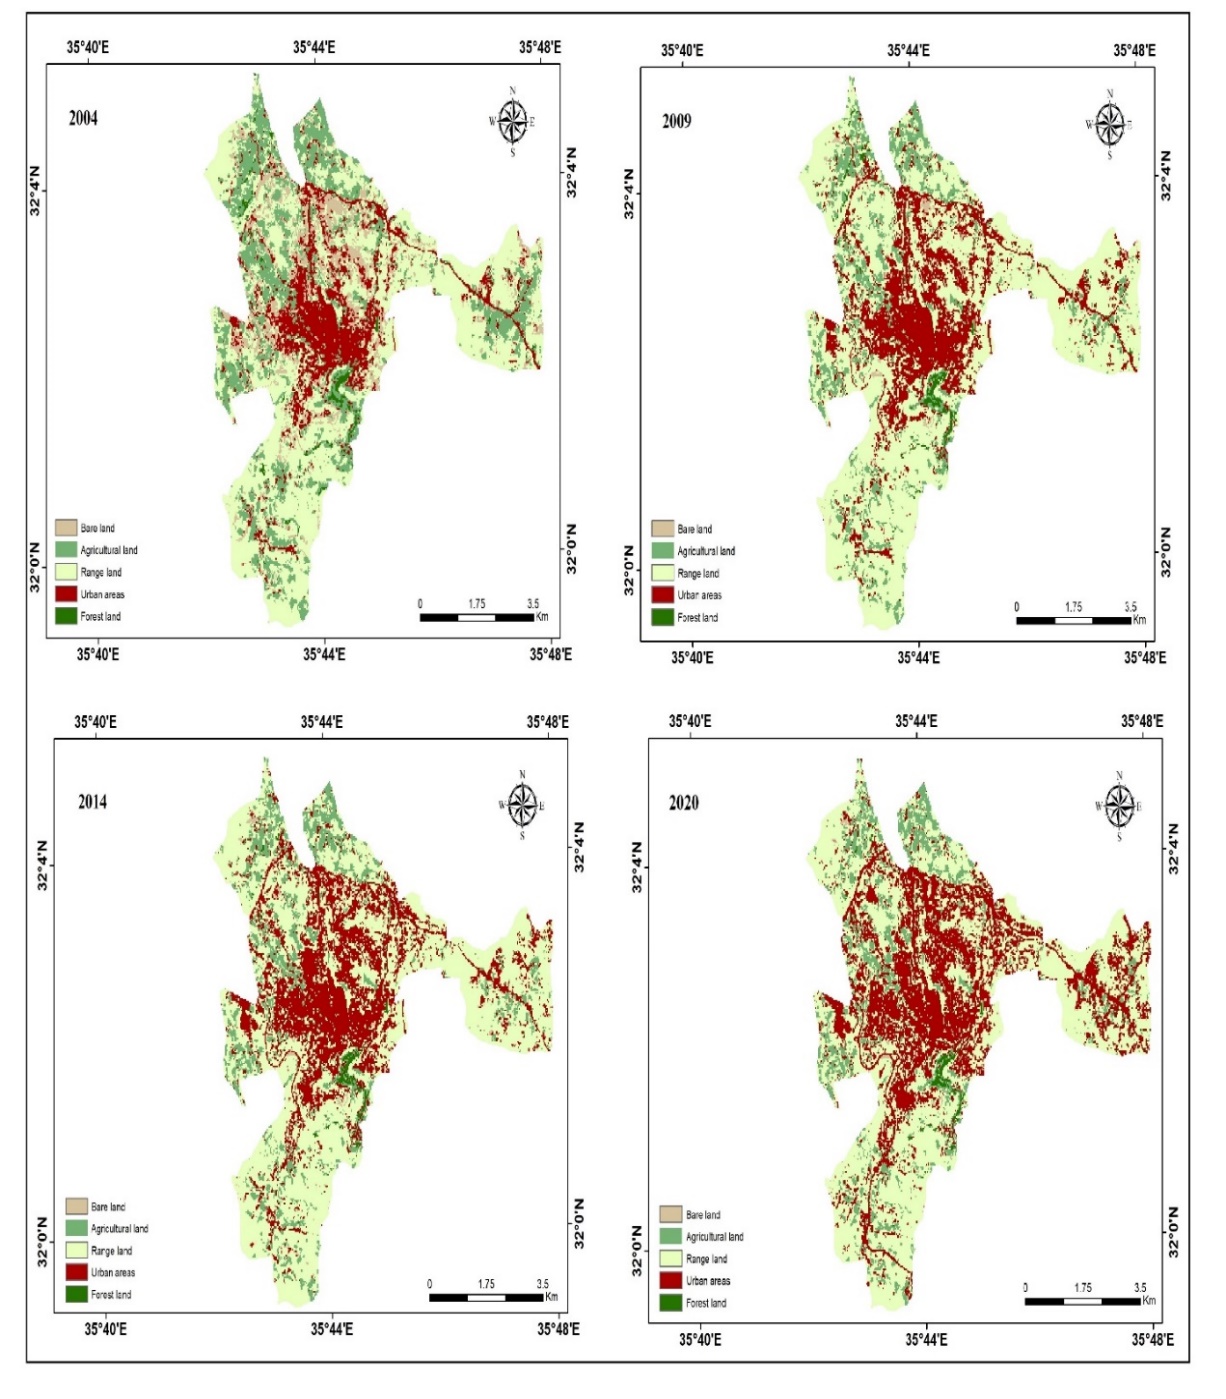 To recognize the changes for the years 2004, 2009, 2014, and 2020, land use/land cover was analyzed using a supervised classification based on ENVI and GIS software to detect and quantify the changes, figure (3).
Figure (3) LULC map in Al-Salt city during the study period
Source (Author.2023)
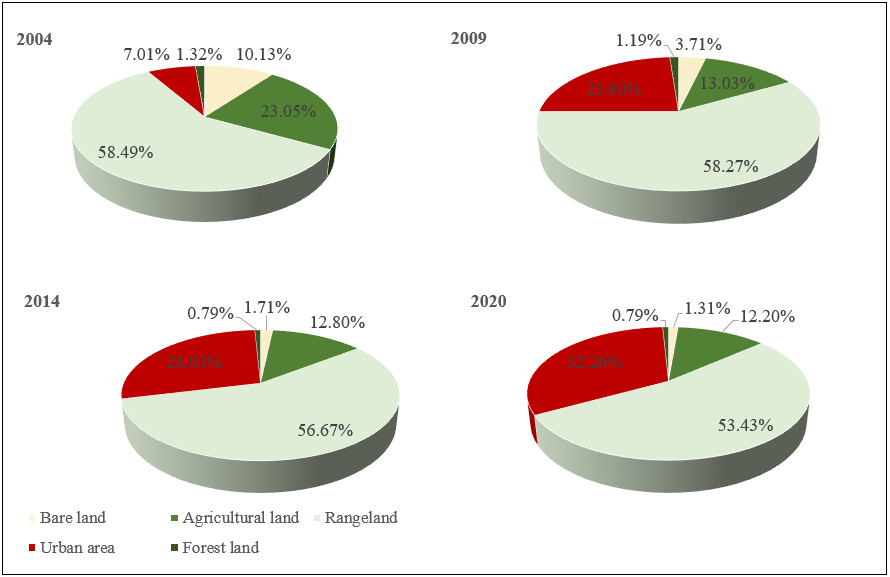 Economic and social developments have occurred in the study area, as represented by an increase in population numbers. Thus, LU/LC has changed to meet the needs of the population The percentage of LU/LC classes of the study period (2004-2020) was computed and illustrated in figure (4). The highest concentration of agricultural land was in 2004 and decreased to record the lowest in 2020. A noticeable decrease in forests and bare land from 2004 to 2020 while increasing in urban areas is obvious. Rangeland represented the predominant land cover category.
Figure (4) Percentage of LULC classes during the study period
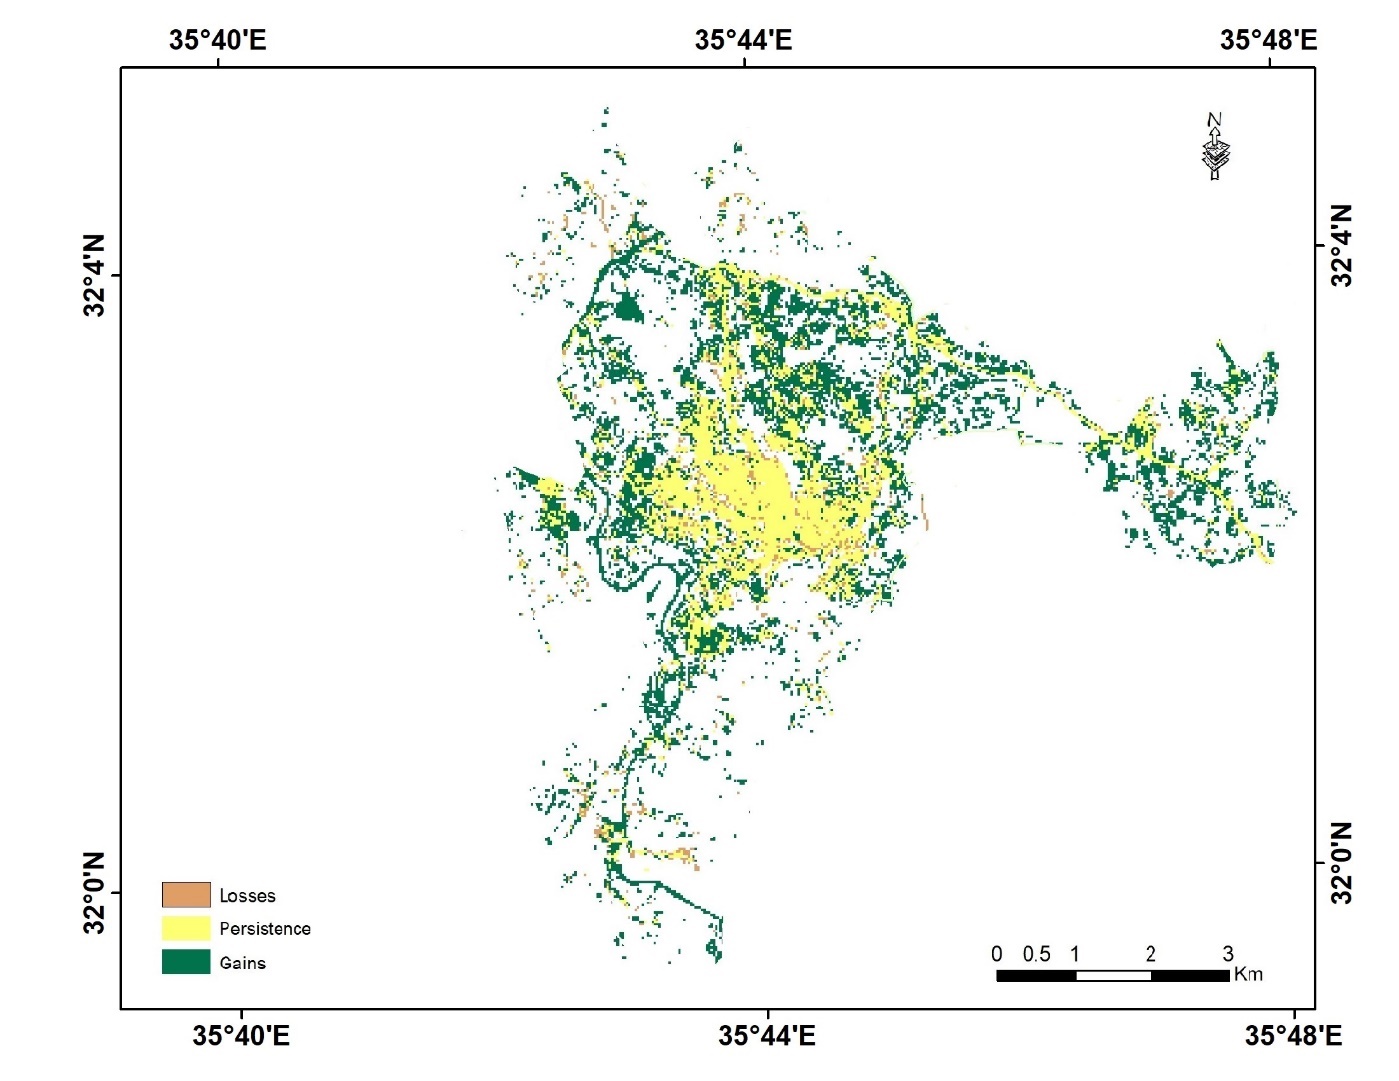 Depicts gains, losses, and persistence in urban areas from 2004 to 2020. Significant shifts and transitions from different land use and cover classes to urban areas, as well as changes from urban areas to various land use and cover classes, were observed. The findings show that the urban area experienced positive growth in its expansion area from 2004 to 2020, figure (5).
Figure (5) Losses, gains, and persistence of the urban area
Source: (Author, ArcGIS 10.7.1 based on TerrSet)
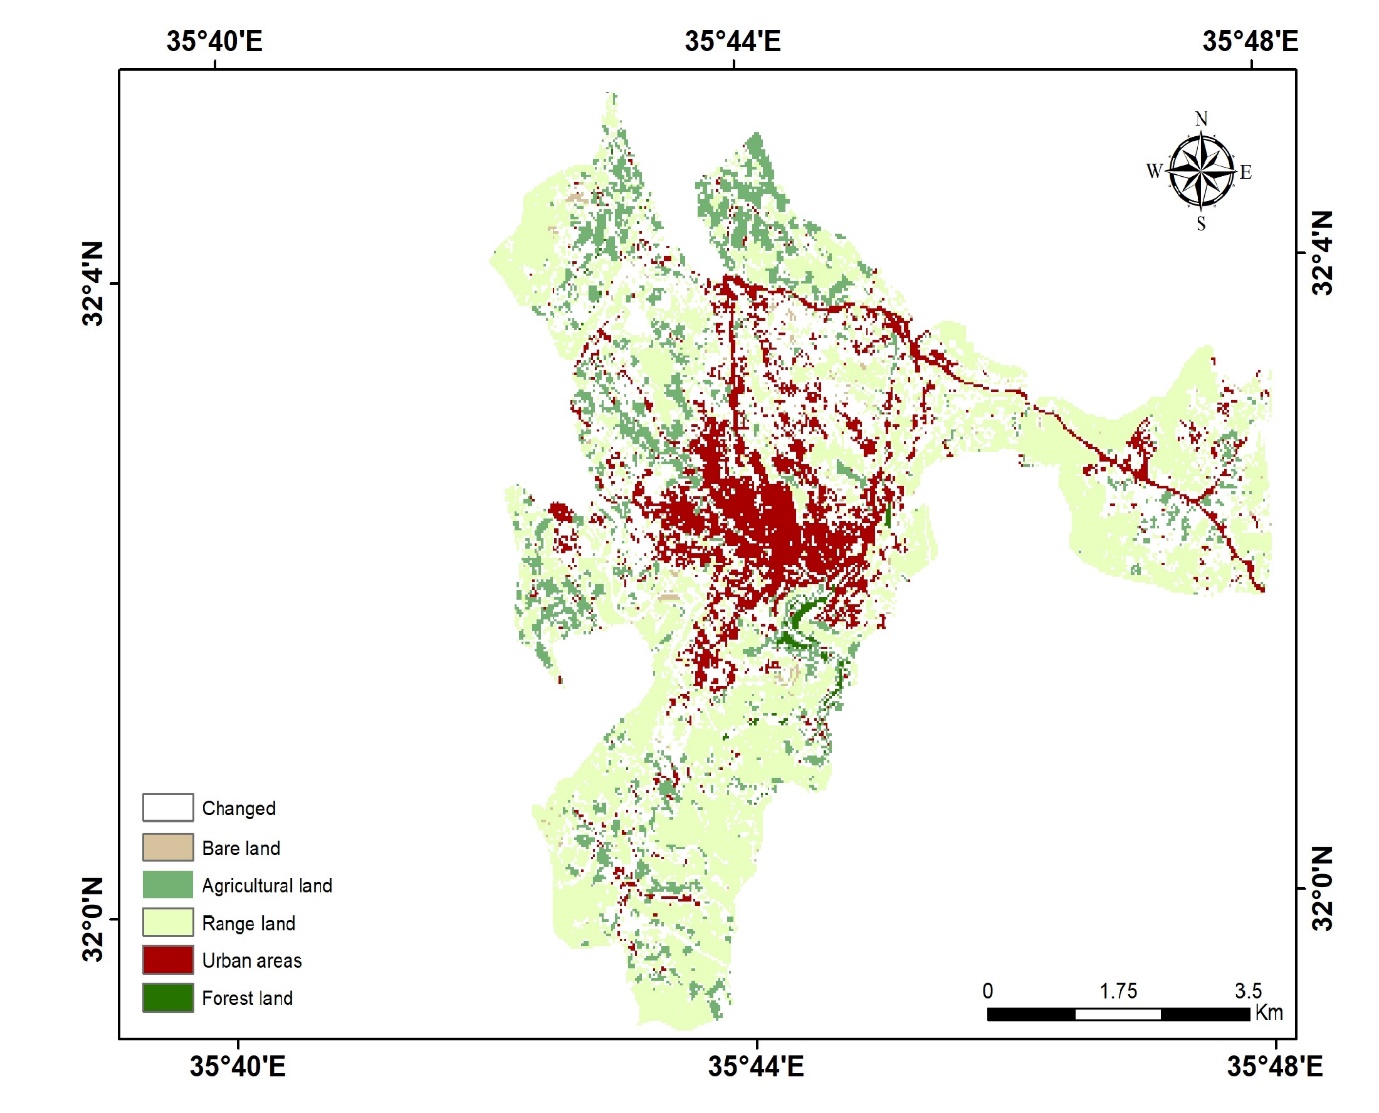 The spatial changes in the five LU/LC classes and the unchanged areas during the period of 2004 to 2020 are shown in figure (6).
Figure (6) Unchanged LU/LC classes (2004 to 2020)
Source: Researcher work using ArcGIS 10.7.1 based on TerrSet
3.1 Analysis of LU/LC conversions
A Markov chain analysis was used to generate the dynamical change in the four LU/LC classes, as illustrated in the transition probability matrix obtained for the periods (2004–2009), (2009–2014), and (2004–2020). The transition probability matrix has values ranging from 0 to 1. The greater the value, the greater the likelihood of moving from horizontal to vertical land cover. The diagonal values in each period’s transition matrix show the likelihood of each land use and land cover class remaining, whereas off-diagonals represent conversions from one category to another (Tadese et al., 2021). Changes in 2030 and 2050 were simulated using the CA-Markov model.
It can be seen from the probability matrix that the urban area has the highest stability to remain unchanged, with a probability of approximately 77%. Likewise, bare land and forest classes could likely change to other land use classes with a high level of instability, with a value of 6.74% and 32.72%, respectively. Rangeland has a probability of 66.23% to remain as rangeland, table (1).
Table (1) Probability of transition class for LU/LC (2004 to 2020)
| LU/LC
Type |
Bare land | Agricultural land | Range
land |
Urban area | Forest land | Total cells |
| Bare land | 0.0674 | 0.0226 | 0.3607 | 0.5493 | 0 | 1 |
| Agricultural | 0.0059 | 0.4326 | 0.4082 | 0.1388 | 0.0146 | 1 |
| Rangeland | 0.0062 | 0.0268 | 0.6623 | 0.3044 | 0.0004 | 1 |
| Urban area | 0.0177 | 0.0358 | 0.1792 | 0.7667 | 0.0005 | 1 |
| Forest land | 0.0071 | 0.1380 | 0.2845 | 0.2432 | 0.3272 | 1 |
Source TerrSet output
3.2 Transition Areas matrix by number of pixels
Rangeland experienced a high amount of stability in the LU/LC category, recording 26988 pixels, 29579 pixels, and 20658 pixels of its total rangeland in the periods (2004–2009), (2009–2014), and (2004–2020), respectively. During the 16 years of the study, the highest-class loss was the change of rangeland to the urban area by 9494 pixels, as shown in table (2).
Table (2) Transition area matrix (2004 to 2020)
Source TerrSet output
3.3 Validation of the Model
Validation is required to calibrate the agreement between the actual image and the predicted land cover map; the Kappa statistical was used to compare the LU/LC maps from 2014 and 2020 with CA-Markov simulations. A Kappa value of 0.8 or higher indicates strong agreement, while a value of 0.4 to 0.8 indicates moderate agreement (Wang et al., 2016). The results show high agreement, with only minor differences between predicted and actual LU/LC values. Kno, K location, and K standard were 0.9367, 0.9585, and 0.8509 in 2014, respectively, while Kno, K location, and K standard were 0.9965, 1, and 0.9917 in 2020, respectively. Kappa indices of the agreement were used to validate and confirm various changes that could occur in the 2030 and 2050 LU/LC maps. The results demonstrated that the CA-Markov model is an effective tool for simulating and analyzing various LU/LC changes in 2030 and 2050, table (3).
Table (3) Summary of Kappa indices for model validation
| Maps used for | Kappa Index | ||||
| validation | |||||
| Observed LULC | Predicted LULC | Digitized LULC | Kno | Klocation | Kstandard |
| 2004-2009 | 2014 | 2014 | 0.9367 | 0.9585 | 0.8509 |
| 2009-2014 | 2020 | 2020 | 0.9965 | 1 | 0.9917 |
Source TerrSet output
3.4 Predicting Land use and Land cover.
To predict LU/LC future maps, the CA-Markov model was implemented in TerrSet software after generating the transition probability matrix and transition area matrix. The predicted maps for 2014 and 2020 were produced, and the validation for the 2014 and 2020 LU/LC predictions was acceptable according to both the actual and predicted comparison of the 2014 and 2020 LU/LC maps. Figure (7), illustrates the prediction LU/LC map in 2014 and 2020, and figure (8) illustrates the prediction LU/LC map in 2030 and 2050the 2014 and 2020 LU/LC maps.
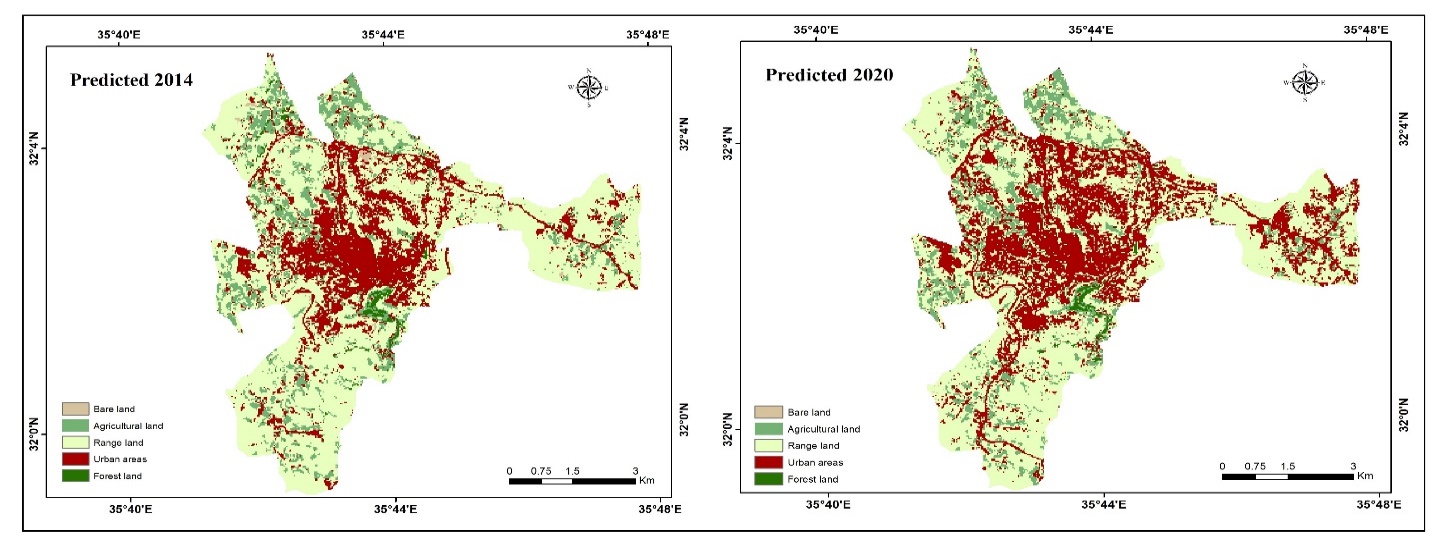 Figure (7) Predicted LULC changes in Al-Salt city in 2014 and 2020
Source TerrSet output
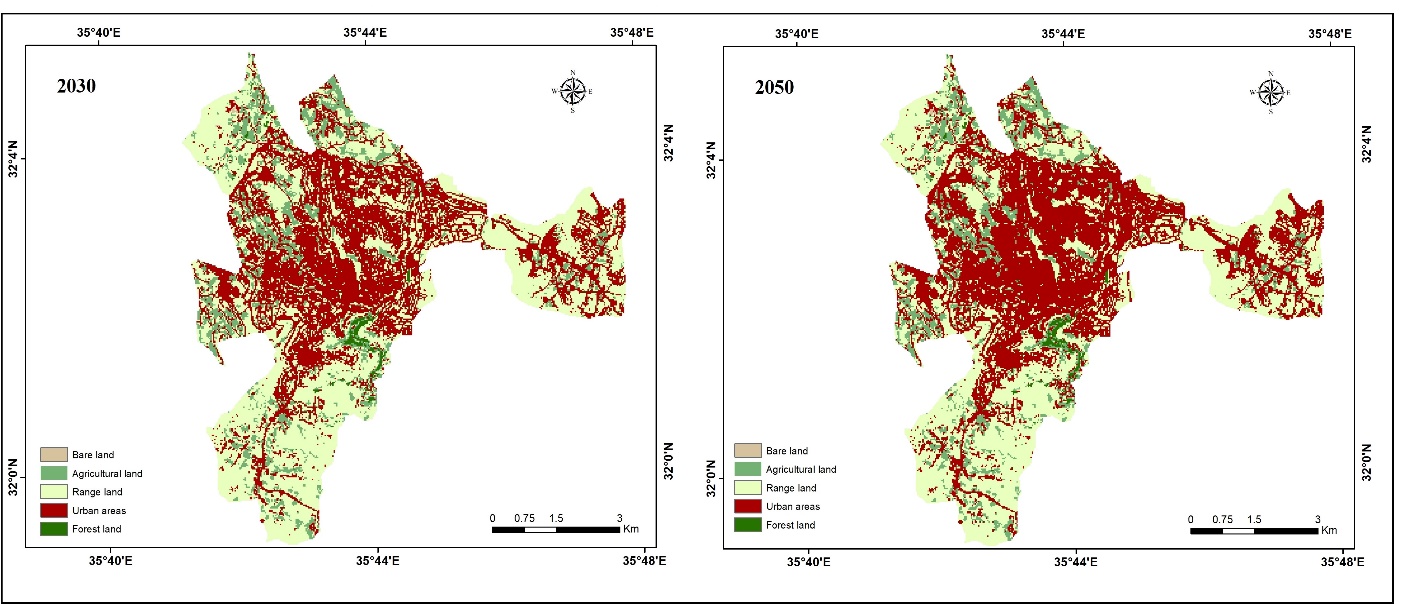
Figure (8) Predicted LULC changes in Al-Salt city in 2030 and 2050
Source TerrSet output
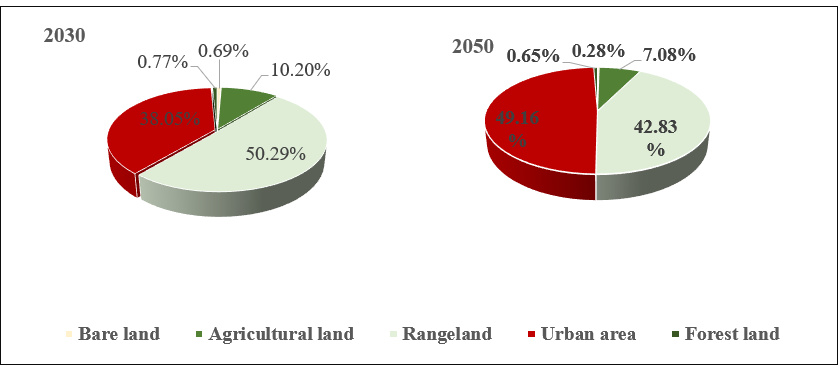 The prediction period was 30 years, from 2020 to 2050, with time intervals of 10 and 30 years for land use and cover change predictions, respectively. The future predictions in this study focused on urban areas. urban areas will continuously increase in 2030 and 2050 and will be expected to cover more than 38.05% of the total study area in 2030 and 49.16% in 2050, respectively. While other land use types will decrease as they convert to urban areas. Generally, these LU/LC types have been replaced by urban areas, figure (9).
Figure (9) Percentage of LU/LC classes in 2030, and 2050
Source (Author.2023)
From 2004 to 2050, the urban area will continue to grow, causing a significant expansion, figure (10).
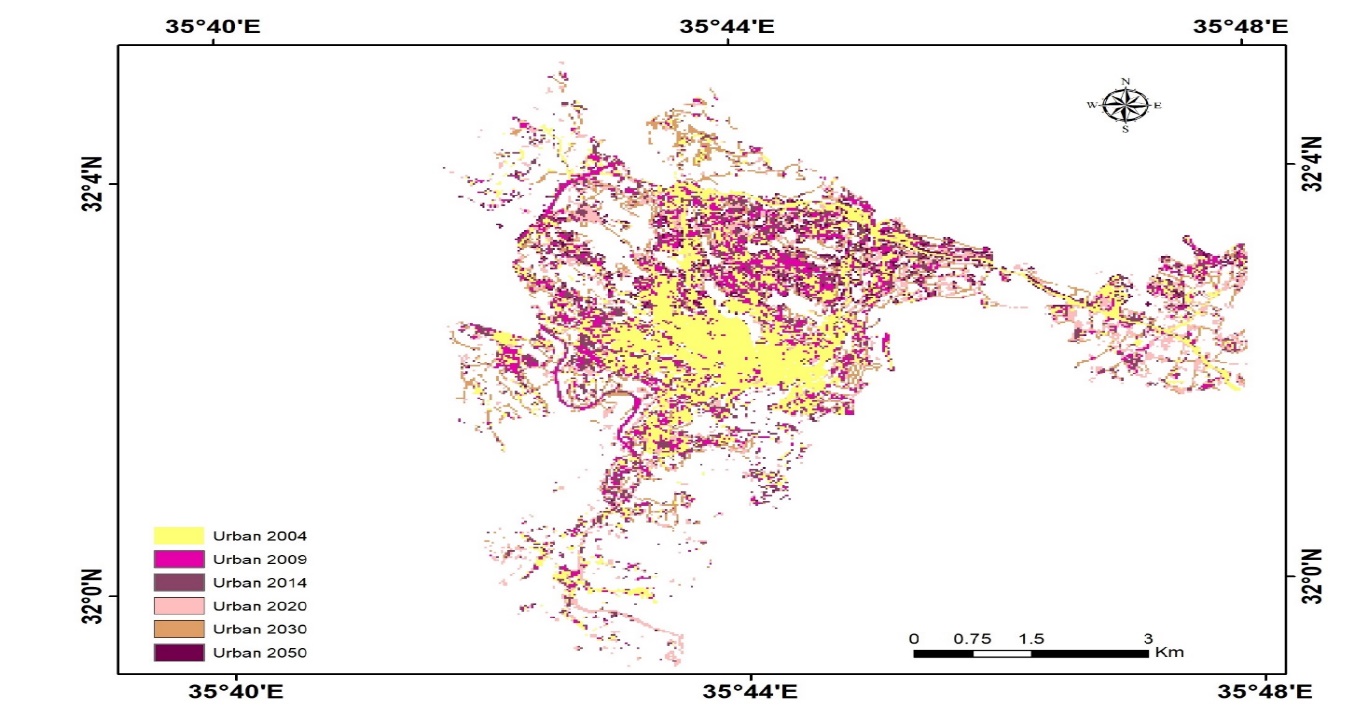 Figure (10) Urban expansion from 2004 to 2050
Source (Author.2023)
4- Conclusion
Simulation of Urban land use changes assessing the impact of the changes in the ecosystem. Geographic information systems, Remote sensing, and Modelling tools combined to accomplish this purpose. The results from this research were summarized in three sections. In the beginning, classified images and their validation were presented to provide information for change analysis and modeling. After that, change analysis detection was implemented, and the results witnessed a noticeable increase in urban areas. At the last, the adopted approach was conducted to predict land use maps in the future. The results of the simulation maps have been validated. However, it still some conflict between the real and simulated maps, and this could be behind the result of classification images. Regardless, the land use maps were forecasting and the results show that the urban areas will continue to expand in the future and will cover approximately 38% of the total study area in 2030 and 49% of the total study area in 2050. While other classes will decrease significantly. The urban area has the highest stability to remain unchanged, with a probability of approximately 77%, while bare land and forest classes could likely change to other land use classes with a high level of instability, with a value of 6.74% and 32.72%, respectively. The overwhelming growth of urban areas led to the consumption of other land classifications, especially agricultural land and bare land.
4- Recommendations
- Issuing laws and legislation to control the increase of urban areas on agricultural and forest land, guarantee the reduction of sprawl urbanization on agricultural land, and decrease environmental pollution.
- Environmental factors, socio-economic perspectives, and land values should be considered as factors for proper city planning and development.
- Increase infrastructure and provide more utilities on the outskirts of the city to reduce the concentration of urban areas in the center of the city Conflict of Interests
- Encouraging residents to live on the outskirts of the city.
- Protection activities in forest areas must be carried out, and it is recommended that trees be planted, particularly in high settlements and bare land areas.
- Rapid developments in the residential, educational, commercial, industrial, recreational, traffic, and transportation sectors have facilitated the expansion of economic and social activities on the landscapes. As a result, it is important to track the LU/LC changes to comprehend the existing situation and plan the city’s future development
Acknowledgment
This work was supported by data form Greater Salt Municipality and the Department of Statistics Jordan.
References
1-Abdulrahman, A. I., & Ameen, S. A. (2020). Predicting Land use and land cover spatiotemporal changes utilizing CA-Markov model in Duhok district between 1999 and 2033. Academic Journal of Nawroz University, 9(4), 71-80.
2-Adhikari, S., & Southworth, J. (2012). Simulating forest cover changes of Bannerghatta National Park based on a CA-Markov model: a remote sensing approach. Remote Sensing, 4(10), 3215-3243.
3-(Department of Statistics (2022). Distribution of Population by Category, Sex, Nationality, Administrative Statistical Divisions and Urban – Rural. The Hashemite Kingdom of Jordan; Ministry of Planning: Amman, Jordan
4-G. R. Pontius and H. Chen, 2006. “GEOMOD Modelling: Land use and cover change modeling tutorial,” Clark Univ.
5-Hamad, R., Balzter, H., &Kolo, K. (2018). Predicting land use/land cover changes using a CA-Markov model under two different scenarios. Sustainability, 10(10), 3421.
6-Kumar, S., Radhakrishnan, N., & Mathew, S. (2014). Land use change modelling using a Markov model and remote sensing. Geomatics, Natural Hazards and Risk, 5(2), 145-156.
7-Leta, M. K., Demissie, T. A., &Tränckner, J. (2021). Modeling and Prediction of Land Use Land Cover Change Dynamics Based on Land Change Modeler (LCM) in Nashe Watershed, Upper Blue Nile Basin, Ethiopia.13(7), 3740.
8-Mishra, V. N., Rai, P. K., & Mohan, K. (2014). Prediction of land use changes based on land change modeler (LCM) using remote sensing: A case study of Muzaffarpur (Bihar), India. Journal of the Geographical Institute” Jovan Cvijic”, SASA, 64(1), 111-127.
9-Tadese, S., Soromessa, T., & Bekele, T. (2021). Analysis of the Current and Future Prediction of Land Use/Land Cover Change Using Remote Sensing and the CA-Markov Model in Majang Forest Biosphere Reserves of Gambella, Southwestern Ethiopia. The Scientific World Journal, 2021.
10-U.S. Geological Survey. (2004). Earth Explorer. Retrieved from https://earthexplorer.usgs.gov/
11-U.S. Geological Survey. (2009). Earth Explorer. Retrieved from https://earthexplorer.usgs.gov/
12-U.S. Geological Survey. (2014). Earth Explorer. Retrieved from https://earthexplorer.usgs.gov/
13-U.S. Geological Survey. (2020). Earth Explorer. Retrieved from https://earthexplorer.usgs.gov/
14-Verburg, P. H., Schot, P. P., Dijst, M. J., &Veldkamp, A. (2004). Land use change modelling: current practice and researchpriorities. GeoJournal, 61(4), 309-324.
