Does Financial Inclusion stimulate the Economic Growth in the Sudan? (2006-2020)
Mozamel ALdai Alabass,*, Issam A.W. Mohamed2
1 PhD student, And Lecturer at Al Neelain University, Faculty of Economics & Social Studies, Department of Economics, Khartoum, Sudan (Mozameledai@gmail.com)
2 Professor of Quantitative Economics Analysis Al Neelain University, Khartoum-Sudan (issamawmohamed@hotmail.com)
HNSJ, 2024, 5(9); https://doi.org/10.53796/hnsj59/5
Published at 01/09/2024 Accepted at 11/08/2024
Citation Methods
Abstract
The paper aimed to answer the question: does financial inclusion stimulate the economic growth in the Sudan? 2006-2020. The researcher has used some financial inclusion indices according to the World Bank indices (the volume of credit to the private sector, the number of Automated Teller Machines, the number of bank branches, the deposits in the banking system, In addition to the doing business index). To measure this effect, the researcher has used the descriptive analytical approach based on Principal Component Analysis (PCA) as well as multiple regression analysis using (SPSS 26) due to its high accuracy in reducing the number of independent variables to factors that have more influence on the dependent variable with the highest rate of variance. Accordingly, the paper found that the first three factors have an impact on economic growth in Sudan by 87.006% loadings.
The paper recommended that: The government, represented by financial and banking institutions, should facilitate access to banking and financial institutions to collect the savings of individuals which helps in capital accumulation that in turn contributes to surge production as well as economic growth. Additionally, adopting an inclusive electronic system that includes a large number of vulnerable segments in society.
Key Words: Panel Principal Component Analysis, Multiple Regression, Financial Inclusion
عنوان البحث
هل يساهم الشمول المالي في تحفيز النمو الاقتصادي في السودان؟ (2006-2020)
HNSJ, 2024, 5(9); https://doi.org/10.53796/hnsj59/5
تاريخ النشر: 01/09/2024م تاريخ القبول: 11/08/2024م
المستخلص
هدفت الورقة إلى قياس أثر الشمول المالي على نمو الاقتصاد السوداني في الفترة 2006-2020م، حيث استخدم الباحث بعض مؤشرات الشمول المالي وفق مؤشر البنك الدولي (حجم الائتمان الموجه للقطاع الخاص، وعدد ماكينات الصراف الآلي، وعدد أفرع المصارف، وحجم الودائع في الجهاز المصرفي، بالإضافة إلى مؤشر سهولة آداء الأعمال). ولقياس ذلك الأثر استخدم الباحث المنهج الوصفي التحليلي بالإعتماد على منهج المكونات الأساسية (Principal Component Analysis) لما يتميز به من دقة عالية في تقليل عدد المتغيرات المستقلة إلى عوامل ذات أكثر تأثيراً على المتغير التابع بأعلى نسبة تباين، وكذلك تحليل الإنحدار المتعدد باستخدام برنامج (SPSS 26)، وعليه توصلت الورقة إلى أن أول ثلاثة عوامل (مكونات Factors) لها أثر على النمو الاقتصادي في السودان بواقع 87.006% للتحميلات loadings. ومن أهم توصيات الورقة: ينبغي على الدولة ممثلة في المؤسسات المالية والمصرفية تسهيل الوصول إلى المؤسسات المصرفية والمالية من أجل جمع مدخرات الأفراد ومن ثم تكوين تراكم رأسمالي يسهم بدوره في زيادة الانتاج وكذلك النمو الاقتصادي، كما أوصت الورقة بتسهيل الائتمان وتبني نظام إلكتروني يشمل قاعدة كبيرة من الشرائح الضعيفة في المجتمع.
- Introduction:
Financial inclusion drew back to the beginning of the 19th century when the cooperative movement took place in 1904 alongside the non-institutional agencies in the form of money lenders who were charging exorbitant interest from poor peasants (Ramananda Singh, 2015). Poverty and income inequality remain a challenge in the world, especially in developing countries despite the slight economic expansion in previous decades, this lifted millions out of poverty. It should also be noted that roughly two out of five of the world’s population are unbanked. Simultaneously, it was found that the external diffusion of bank branches boosts the financial inclusion of low-income families, especially if this growth includes rural areas. Therefore, financial inclusion enables low-income banking families to accumulate durable assets such as cars and so on (Cyn-Young Park and Rogelio V. Mercado, 2015). Financial inclusion is often considered a critical element that makes growth inclusive as access to finance can permit economic institutions to make longer-term consumption and investment decisions, participate in productive activities, and cope with unpredicted short-term shocks (Cyn-Young Park and Rogelio V. Mercado, 2015) Also, financial inclusion is essential for economic development and poverty reduction. It can also be a way of preventing social exclusion financial services, as a way of preventing social exclusion, must be a priority (Tuesta, 2014). The lack of access and usage of a larger percentage of working adults to the formal financial sector has created a huge gap between poor and rich people that caused many economic problems in Sudan, one of which is income inequality that deepens the poverty levels in the country as well as reducing the GDP growth, which plays a significant role in economic development. Thus, this paper will state the following questions: What is the impact of financial inclusion on economic growth? And what is the impact of economic growth on financial inclusion?
This paper has a scientific contribution to the existing literature by presenting the significance of financial inclusion on economic growth in Sudan. Moreover, the empirical contribution through which financial institutions benefit from the empirical results and policy implications to build reliable and sustainable fiscal and monetary policies. In addition, the study will show how financial inclusion contributes to the reduction of poverty, and income inequality levels in the Sudanese economy. Banking services do not reach the appropriate number of adult people due to many financial and nonfinancial obstacles including income levels, the lack of financial awareness, and other demographic issues. Tackling poverty issues, GDP growth, and improving financial markets have a major effect on embracing a huge number of people in financial institutions. Therefore, the paper aimed at examining the impact of financial inclusion on economic growth and vice versa.
On this basis, the paper hypothesized that there is a positive significant statistical impact of financial inclusion on economic growth in Sudan. It seems that financial inclusion has been searched due to the number of studies published on it, but we believe that it is a fertile subject that needs more studies that address various aspects of it and in some countries like Sudan in which the topic has not been written a lot about. Here the importance of our paper arises at the same time what distinguishes it from the rest of the studies.
- Data Sources and Empirical Methodology:
Panel data were collected from secondary sources including the annual reports of the Central Bank of Sudan, and World Bank data. Building on the literature review specifically (Mansor Nadjim (2022), Faycal Chiad, Ahcene Lahsasna, and Amine Aouissi (2021), Kumari D.A.T (2021), Thi Truc Huong Nguayen (2020), Noelia Camara and David Tuesta (2014)) this paper will heavily apply the following model to examine the statistical relationship between dependent variables economic growth which proxies by Real Gross Domestic Product (RGDP) and financial inclusion indices. The research methodology will apply Panel Principal Component Analysis (PCA) (Maddala, 1992), and multiple regression Analysis to measure the impact of financial inclusion on the growth of the Sudanese economy during 2006-2020 (Kothari, 1990) .
Where, the subscript = 1; and t = 1,…, T denotes the time; b0 represents the constant of the model; stands for branches of banks per 1000 individuals; Gdppct represents Gross Domestic Product Per Capita Income, Financial Inclusion includes several variables such as ( ATM, number of Bank Branches br, Credit to private sector , bank deposits bdeps, FDt denotes Financial Deepening, doings denotes the ease of doing business, stands for total finance and denotes to the random variable.
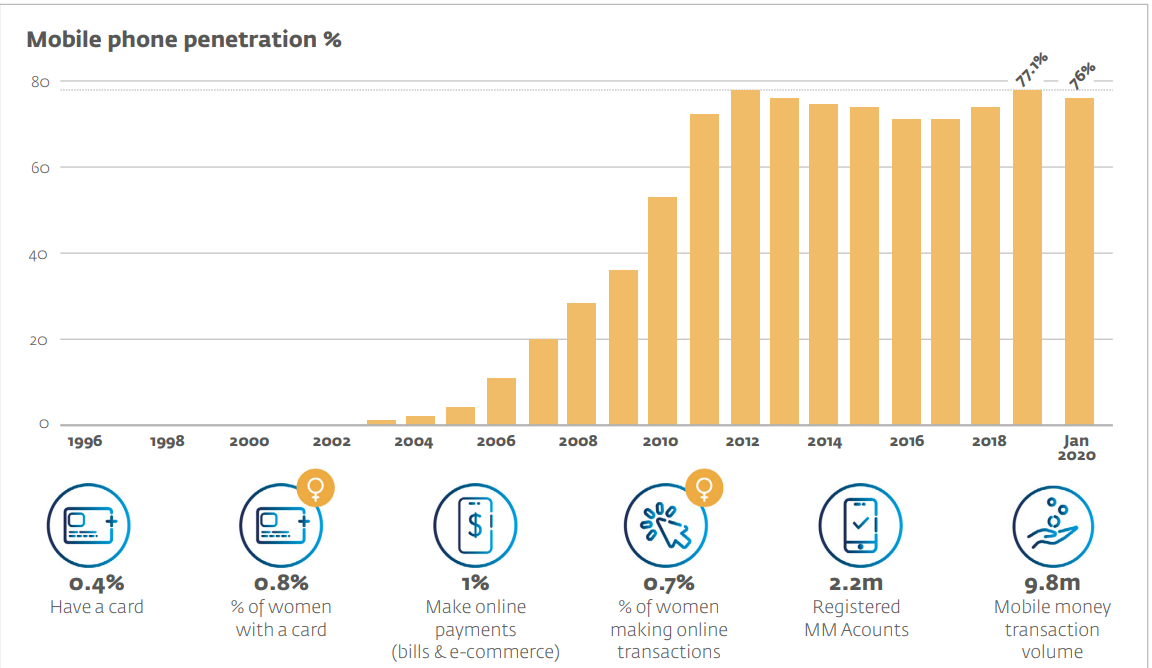
Figure 1, Sudan Key Access Metrics:
Source 2, International Finance Corporation, 2010.

The figure, Financial Access Points per 100.000 Adult Populations
Source: International Finance Corporation (IFC), p4.
Sudan is a vast country with a mostly rural and young population. While only 15% of the population holds bank accounts, mobile phone is second only to Egypt as 77.1 % of all Sudanese had access to a mobile phone in 2019, with a year-on-year growth of 7.5% (World Bank Data, 2019). There were also 13.38 million internet users an increase of 2.4% over 2019 (316 000 new users) resulting in 31% internet penetration (Corporation, 2020). The high mobile phone penetration coupled with the young age of the population and the large addressable market presents an opportunity to significantly expand digital financial services (Olusegun Akanbi, 2020).
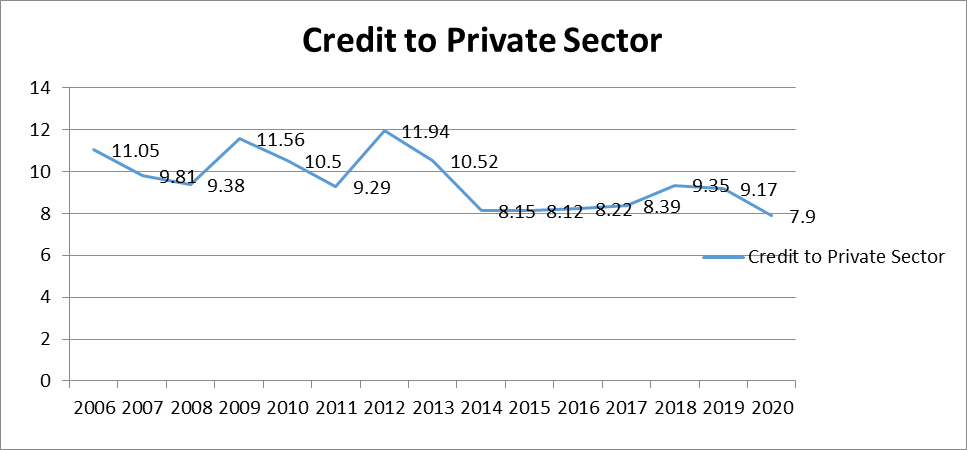
Figure 3, shows credit to the private sector (in million USD) from 2006-2020.
Source: Central Bank of Sudan, Annual Report 2006-2020
According to the above figure, there is a fall in the volume of credit to the private sector from 11.5 million dollars in 2006 to 9.38 million dollars in 2008. Also, there was a slight increase in 2008 from 9.3 to 11.56 in 2009 in addition to a sharp decline from 2014 to 2019 due to the effect of South Sudan secession.
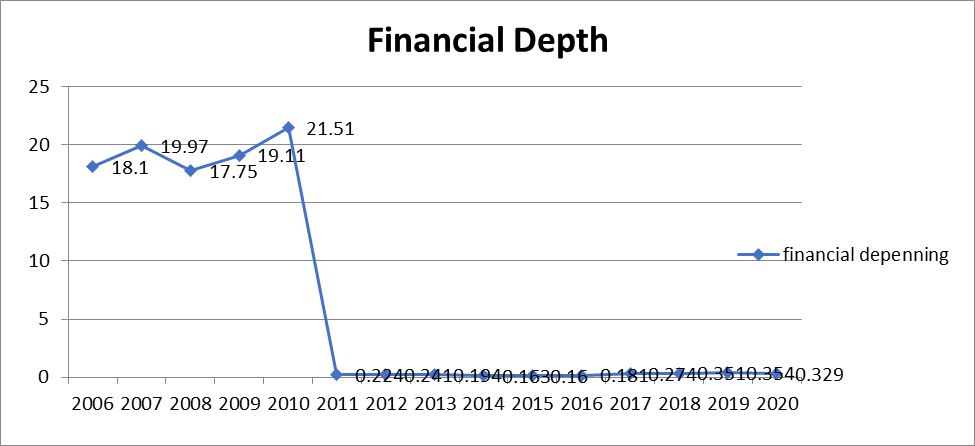
Figure 4, shows financial depenning (in million USD) from 2006-2020.
Source: Central Bank of Sudan, Annual reports 2006 to 2020
According to the above figure, we notice that there is a constant increase in the financial depth index from 2006 to 2010, but there is a sharp decline in this index from 21.5% in 2010 to 0.22% in 2011 to 2020 respectively.
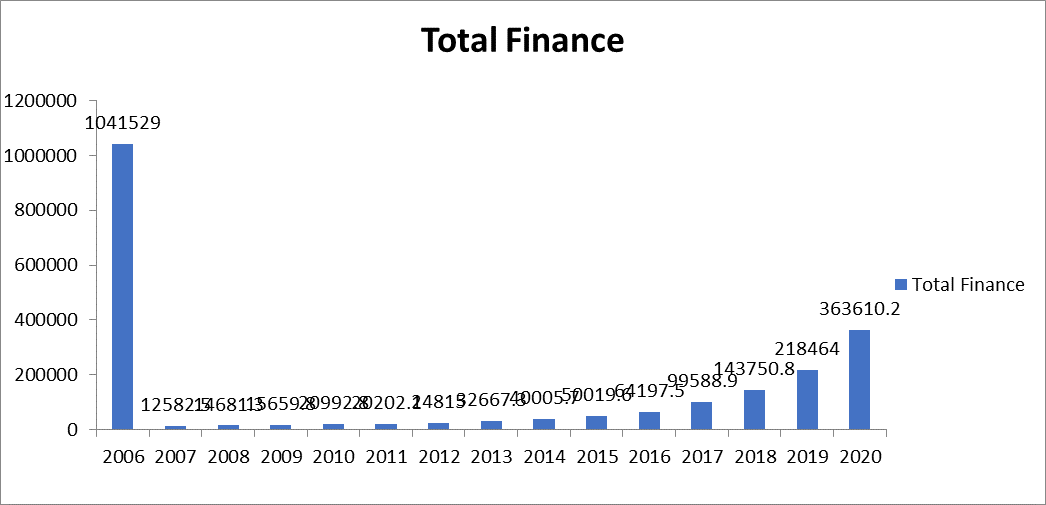
Figure 5, Total Finance in Sudan from 2006 to 2020
Source: Central Bank of Sudan, Annual Report 2006-2020
A proxy variable that has received much attention in the empirical literature in this regard is private credit relative to gross domestic product (GDP). More specifically, the variable is defined as domestic private credit to the real sector by deposit money banks as a percentage of local currency GDP. Therefore, the figure shows a huge gap between financial depth in 2006 and 2020.
- Theoretical and Empirical Literature Review:
Financial inclusion is a broad concept (Ozili, 2022), defined financial inclusion as the provision of access to financial services to all members of the population mainly the poor and the other excluded members of the population. Similarly, financial inclusion is the easiness of access to, and the accessibility of basic financial services to all members of the society. Financial inclusion means that individuals and businesses have access to useful and affordable financial products and services that meet their needs responsibly and sustainably (Karpowicz, 2014). Sarma defined it (2008), that financial inclusion is the process that ensures the accessibility, availability, and usage of an official financial system for all society members of an economy (Cyn-Young Park and Rogelio V. Mercado, 2015). Moreover, the definition of the Committee on Financial Inclusion states “Financial inclusion is the process of ensuring access to financial services and timely and adequate credit when needed by helpless people such as the vulnerable sections and low-income people at an affordable cost by mainstream financial institutions players” (Ramananda Singh, 2015). As seen the concepts and definitions mentioned by various scholars have focused on the major dimensions and determinants of financial inclusion such as usage, access, and quality. This means that financial services do not mean only banking products, but a host of other financial services like credit, insurance, and other types of equity products.
(Nadjim, 2022) Analyzed the effect of financial inclusion on the economic growth in Algeria, Morocco, Tunisia, and Egypt from 2004 to 2019; he used the panel Autoregressive Distributive Lag (ARDL) method. Also, Principal Component Analysis was used to determine financial inclusion. The study mainly focused on bank branches, Automated Teller Machines, and GDP to express economic growth. He found that there is a long-term positive relationship between financial inclusion and economic growth in these countries. (Faycal Chiad, 2021) Investigated the relationship between financial inclusion, trade openness, human development, and GDP growth in Algeria. They used the Autoregressive Distributive Lag (ARDL) technique to examine the cointegration between variables. Their findings revealed that there is a positive and significant impact on economic growth in the short and long run. (D.A.T, 2021) Examining the determinants of financial inclusion in Sri Lanka, he used 400 individual adults’ responses across the country. The study used a structured model by using path coefficients, their study revealed that both the impact index and quality index have made a significant impact on financial inclusion. (Nguyen, 2020) Focused on measuring financial inclusion in developing countries. He used a two-stage Principal Component Analysis method to construct a composite financial inclusion index. Through the method, he built on a comprehensive measure of financial inclusion. Moreover, he emphasized the role of financial inclusion in the economy. (Ghazi, 2019) Aimed to get a proposed framework for measuring and interpreting the impact of financial inclusion on achieving inclusive growth in Egypt. The study used a regression model through the SPSS technique. Her findings showed that the change in financial inclusion affects employment, GDP per capita, and standard of living. (Ragab, 2018) Aimed at contributing to the existing literature by computing an index for financial inclusion in Arab countries. He applied various statistical techniques such as principal component analysis, Hierarchical Clustering, structural equation model, Multiple Linear Regression Model, and Simultaneous equation model. Thus, he found that there is a statistical relationship between financial inclusion indicators and Gross Domestic Product in Arab countries. (Khedr, 2018) Have studied the concepts of financial inclusion and its importance in improving development. He stated that financial inclusion provides advanced financial services such as transactions, savings, payment, and insurance. (Sulong, 2018) Described the effect of financial inclusion on economic growth; they used multidimensional variables to examine the relationship between financial inclusion and economic growth. (Cyn-Young Park and Rogelio V. Mercado, 2015) Have studied financial inclusion, poverty, and income inequality in developing Asia. The study was constructed by concentrating on macroeconomic indicators of 37 countries in Asia; the study ran three regression models to test the data, they found that per-capita income, rule of law, and demographic structures considerably affect financial inclusion in Asia. Moreover, they proved that financial inclusion lowers income inequality. The merits of this study, it focused on the major factors that affect income equality such as per capita income, and enforcing financial contracts. (Abiola A. Babajide1, 2015) Investigated the impact of financial inclusion on economic growth in Nigeria; they mainly focused on the determinants of financial inclusion. Data were obtained from the world development indicator, and the Least Square Method was applied to examine a statistical relationship between variables. The results revealed that financial inclusion is a significant determinant of production as well as capital per worker which determines the final level of the overall economic output. (Ramananda Singh, 2015) Measured the demand-supply side of financial inclusion, the study mainly focused on how to assess and measure financial inclusion. Therefore, they have included usage and access in their study as financial inclusion indicators. (Karpowicz, 2014) Studied financial inclusion, growth, and inequality in Colombia, she aimed at microcredit to the poor in addition to spreading banking systems usage. She mainly focused on the simulation equilibrium model to identify the most frictions that impede financial inclusion. Her main finding is that lowering constraints on collateral promises higher growth while inequality could be tackled through some measures that lower financial participation costs. (Tuesta, 2014) measured the extent of financial inclusion for 82 developed and less-developed countries, they relied on the demand and supply side of financial inclusion, and their study was determined by three scopes; usage, barriers, and accessibility to financial inclusion. They employed a two-stage principal component Analysis. They found that financial inclusion is highly correlated with other macroeconomic variables including GDP per capita, as well as financial stability.
- Empirical Results and Discussion:
Table 1, Descriptive Statistics
| Descriptive Statistics | |||||||
| N | Mean | Std. Deviation | Skewness | Kurtosis | |||
| Statistic | Statistic | Statistic | Statistic | Std. Error | Statistic | Std. Error | |
| CPS % GDP | 15 | 9.5567 | 1.31027 | .450 | .580 | -.944 | 1.121 |
| bank deposits | 15 | 11.47507 | 4.035813 | -1.257 | .580 | 4.724 | 1.121 |
| financial depending | 15 | 6.59407 | 9.326546 | .815 | .580 | -1.514 | 1.121 |
| bank branches | 15 | 2.9367 | .40841 | -.499 | .580 | -1.608 | 1.121 |
| ATMs | 15 | 3.8933 | 1.85365 | -.523 | .580 | -.719 | 1.121 |
| total Fina | 15 | 144184.433 | 266570.9659 | 3.122 | .580 | 10.434 | 1.121 |
| doing business | 15 | 154.67 | 10.506 | -.036 | .580 | -.582 | 1.121 |
| M2 | 13 | 203765.73 | 371959.605 | 2.557 | .616 | 6.370 | 1.191 |
| GE | 14 | 8480.11 | 2304.559 | .749 | .597 | -.689 | 1.154 |
| Gdppc | 15 | 745.0587 | 119.48858 | -.465 | .580 | -1.533 | 1.121 |
| RGDP | 15 | 3145.1453 | 8229.23228 | 2.419 | .580 | 4.463 | 1.121 |
| Valid N (listwise) | 12 | ||||||
Source: SPSS 26, the author
Table 2, Correlation Matrix
| CPS % GDP | bank deposits | financial depend | bank branch | ATMs | total Fina | doing business | M2 | GE | Gdppc | RGDP | |
| CPS % GDP | 1 | ||||||||||
| bank deposits | 0.28 | 1 | |||||||||
| financial depending | 0.741 | 0.07 | 1 | ||||||||
| bank branches | -0.791 | -0.097 | -0.936 | 1 | |||||||
| ATMs | -0.747 | -0.139 | -0.812 | 0.928 | 1 | ||||||
| total Fina | 0.246 | -0.246 | 0.237 | -0.174 | -0.371 | 1 | |||||
| doing business | -0.629 | -0.233 | -0.486 | 0.681 | 0.729 | 0.129 | 1 | ||||
| M2 | -0.421 | -0.483 | -0.363 | 0.541 | 0.614 | 0.192 | 0.687 | 1 | |||
| GE | 0.477 | 0.097 | 0.629 | -0.792 | -0.673 | -0.246 | -0.657 | -0.534 | 1 | ||
| Gdppc | -0.778 | 0.019 | -0.888 | 0.948 | 0.906 | -0.373 | 0.567 | 0.38 | -0.752 | 1 | |
| RGDP | 0.42 | -0.087 | 0.39 | -0.394 | -0.612 | 0.935 | -0.14 | -0.165 | -0.027 | -0.539 | 1 |
Source: SPSS 26, the author
From Table (2) we can understand that most items have some correlation with each other ranging from 0.3 for the credit to the private sector 0.7 to for financial deepening. Also, bank branches 0.9 with Automated Teller Machine, Due to relatively high correlations among items. As for the variable financial deepening, we observe that is highly negatively correlated with bank branches -0.93 and -0.812 with Automated Teller Machines (ATMs). This would be a good candidate for factor analysis. Recall that the objective of factor analysis is to model the interrelationships between items with fewer variables. These interrelationships can be broken up into multiple components since the aim of factor analysis is to model the interrelationships among items.
Table 3, KMO and Bartlett’s Test
| Kaiser-Meyer-Olkin Measure of Sampling Adequacy. | 0.255 | |
| Bartlett’s Test of Sphericity | Approx. Chi-Square | 197.322 |
| df | 55 | |
| Sig. | 0.00a |
Source: SPSS 26, the author
- Kaiser-Meyer-Olkin (KMO) and Bartlett’s Test measures the sampling adequacy which should be between 0 and 1 for a satisfactory factor analysis to proceed. With small values indicating that the overall variables have little in common to warrant a principal components analysis, values above 0.5 are considered satisfactory for PCA. Here the KMO tests the sample adequacy achieved is (0.000) which shows that the relationship among variables is significant at (0.000). Similarly, the KMO test checks whether the correlation matrix is significant or not in which the correlation between the variables is all zero.
- Bartlett’s Sphericity Test is used to display whether the original correlation matrix is the unit matrix or not. Accordingly through Table (2) we observe that the value of the Bartlett test is (197.322), while the level of significance is (0.000). This demonstrates that the correlation matrix is not the identity matrix. Therefore, we can use the principal component analysis in the study.
Table 4, Communalities
| Communalities | ||
| Initial | Extraction | |
| CPS % GDP | 1 | 0.723 |
| bank deposits | 1 | 0.816 |
| financial depending | 1 | 0.819 |
| bank branches | 1 | 0.978 |
| ATMs | 1 | 0.954 |
| total Fina | 1 | 0.987 |
| doing business | 1 | 0.718 |
| M2 | 1 | 0.769 |
| GE | 1 | 0.879 |
| Gdppc | 1 | 0.967 |
| RGDP | 1 | 0.96 |
Source: SPSS 26, the author
Communality shows how much of each variable is accounted for by underlying factors taken together. A high value of communality means that not much of the variable is left over after whatever the factors represent is taken into consideration.
Table 5, Total Variance Explained
| Component | Initial Eigenvalues | Extraction Sums of Squared Loadings | Rotation Sums of Squared Loadings | ||||||
| Total | % of Variance | Cumulative % | Total | % of Variance | Cumulative % | Total | % of Variance | Cumulative % | |
| 1 | 6.123 | 55.667 | 55.667 | 6.123 | 55.667 | 55.667 | 5.444 | 49.494 | 49.494 |
| 2 | 2.298 | 20.889 | 76.555 | 2.298 | 20.889 | 76.555 | 2.382 | 21.656 | 71.15 |
| 3 | 1.15 | 10.451 | 87.006 | 1.15 | 10.451 | 87.006 | 1.744 | 15.856 | 87.006 |
| 4 | 0.631 | 5.733 | 92.739 | ||||||
| 5 | 0.394 | 3.581 | 96.32 | ||||||
| 6 | 0.224 | 2.036 | 98.356 | ||||||
| 7 | 0.143 | 1.301 | 99.657 | ||||||
| 8 | 0.031 | 0.286 | 99.943 | ||||||
| 9 | 0.005 | 0.045 | 99.987 | ||||||
| 10 | 0.001 | 0.013 | 100 | ||||||
| 11 | 2.380 | 2.1705 | 100 |
Source: SPSS 26, the author
Eigenvalue indicates the relative importance of each factor in accounting for the particular set of variables being analyzed. Factor loadings explain how closely the variables are related to each one of the factors discovered. They are known as factor-variable correlations. Hence, table 5 illustrates initial Eigenvalues which show that the first three factors have the highest Eigenvalues 6.123, 2.298, and 1.15 respectively. Additionally, the cumulative with the highest rate is 87.006.
Figure 6, Scree Plot
Source: SPSS 26, the author
Table 4, Rotated Component Matrix
| Rotated Component Matrix | |||
| Component | |||
| 1 | 2 | 3 | |
| bank branches | 0.968 | ||
| Gdppc | 0.928 | -0.325 | |
| GE | -0.88 | -0.314 | |
| financial depending | -0.875 | ||
| ATMs | 0.865 | -0.379 | |
| CPS % GDP | -0.726 | 0.313 | -0.314 |
| doing business | 0.721 | 0.433 | |
| total Fina | 0.972 | ||
| RGDP | 0.944 | ||
| bank deposits | -0.9 | ||
| M2 | 0.492 | 0.722 |
Source: SPSS 26, the researcher
- PC1= 0.968 X1+ 0.928 X2 -0.88 X3 -0.875 X4 + 0.865 X5 -0.726 X6 + 0.721 X7 + 0.00 X8+ 0.00 X9 + 0.00 X10 + 0.492 X11
- PC2= 0.00 X1 -0.325 X2 -0.314 X3 + 0.00 X4 + -0.379 X5 + 0.313 X6 + 0.00 X7+ 0.972 X8 + 0.944 X9+ 0.00 X10+ 0.00 X11
- PC3= 0.00 X1+ 0.00 X2+ 0.00 X3+ + 0.00 X4+ 0.00 X5 -0.314 X6 + 0.433 X7 + 0.00 X8+ 0.00 X9 -0.9 X10 + 0.722 X11
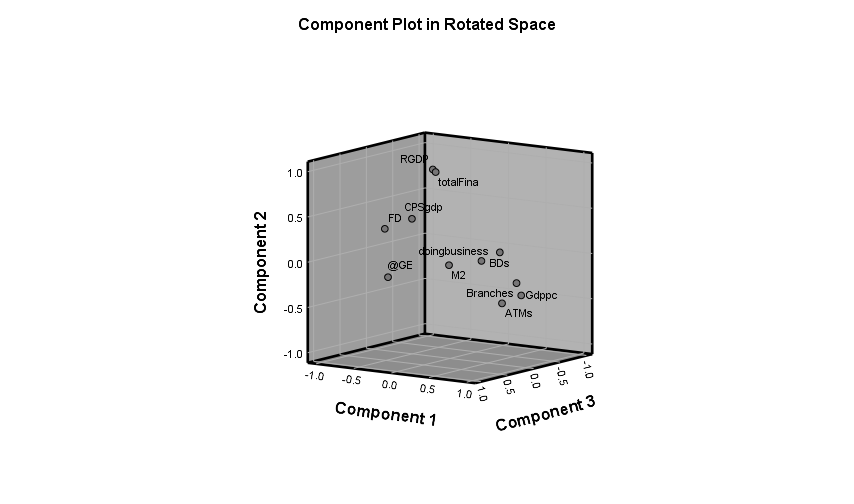
As a common rule stated “When a factor has a relation greater than 0.30 with three variables or more, it can be considered an adequate factor. Equation (A) extracted from table (4) shows that factor one (PC1) has a strong relationship with another variable including positive relation with bank branches 0.96, GDPPCI 0.928, financial deepening -0.88, ATMs 0.86, and credit to private sector. Also, we observe that factor 2 has a strong positive relation with two variables one is total finance 0.97, and another one is Real GDP 0.944. As for factor number 3 has loadings on the variable Money supply (M2) 0.722.
Table 5, Component Transformation Matrix
| Component Transformation Matrix | |||
| Component | 1 | 2 | 3 |
| 1 | 0.927 | -0.27 | 0.258 |
| 2 | 0.12 | 0.87 | 0.478 |
| 3 | 0.354 | 0.412 | -0.839 |
Source: SPSS 26, the author
Figure 7, Component Plot in Rotated Spot
Source: SPSS 26, the author
Table 6, Regression Analysis:
| Model | R | R2 | Adjusted R2 | Std. Error of the Estimate | Change Statistics | change statistics | change statistics | change statistics | change statistics | D.W |
| R Square Change | F Change | df1 | df2 | Sig. F Change | ||||||
| 1 | .991a | 0.981 | 0.970 | 1103.57813 | 0.981 | 90.869 | 4 | 7 | 0.000 | 1.069 |
Source: SPSS 26, the author
As shown in the regression analysis table the R-square (R2) or the goodness of fit equals 0.98, explaining that 0.98% of the total variation of (y) is caused by the explanatory variables while only 0.02 is explained by the residuals. In addition to the value of Durbin Watson statistics is 1.069
Table 7, Analysis of Variance (ANOVA)
| Model | Sum of Squares | df | Mean Square | F | Sig. | |
| 1 | Regression | 4.44267.06 | 4 | 11066805.01 | 90.869 | .000a |
| Residual | 8525192.8 | 7 | 1217884.682 | |||
| Total | 4.51197293.8 | 11 |
Source: SPSS 26, the author
F- Distribution with degrees of freedom k and (n-k-1) = 7, the hypothesis stated that none of the X’s variables influence (y); that is the regression equation is useless. As illustrated in the Analysis of Variance table (7) F- the value is highly significant (sig= 0.00). Surely we reject the hypothesis that b1=b2…=0. Meaning that all variables are important in explaining the variation in average cost.
Table 8, Coefficients
| Model | Unstandardized Coefficients | Standardized Coefficients | t | Sig. | Collinearity Statistics | |||
| B | Std. Error | Beta | Tolerance | VIF | ||||
| 1 | (Constant) | 14874.21 | 4669.457 | 3.185 | 0.015 | |||
| CPS % GDP | -1389.15 | 498.022 | -0.276 | -2.789 | 0.027 | 0.277 | 3.616 | |
| REGR factor score 1 for analysis 1 | -2933.76 | 567.068 | -0.458 | -5.174 | 0.001 | 0.344 | 2.904 | |
| REGR factor score 2 for analysis 1 | 6600.132 | 387.222 | 1.031 | 17.045 | 0.00 | 0.738 | 1.354 | |
| REGR factor score 3 for analysis 1 | -827.862 | 387.669 | -0.129 | -2.135 | 0.07 | 0.737 | 1.357 | |
Source: SPSS 26, the author
To estimate how much of the variance of a regression coefficient is inflated or not, we run variance inflation factors (VIF) which shows that the Multicollinearity problem does not exist between independent variables for VIF is less than 5.
RGDP= 14874.21 -2933.76 F1 + 6600.132 F2 -827.862 F3+ i
Table 9, Coefficient Correlations
| Model | REGR factor score 3 for analysis 1 | REGR factor score 2 for analysis 1 | REGR factor score 1 for analysis 1 | CPS % GDP | ||
| 1 | Correlations | REGR factor score 3 for analysis 1 | 1 | -0.262 | 0.416 | 0.513 |
| REGR factor score 2 for analysis 1 | -0.262 | 1 | -0.414 | -0.511 | ||
| REGR factor score 1 for analysis 1 | 0.416 | -0.414 | 1 | 0.81 | ||
| CPS % gdp | 0.513 | -0.511 | 0.81 | 1 | ||
| Covariances | REGR factor score 3 for analysis 1 | 150287.2 | -39396.72 | 91342.23 | 99068.06 | |
| REGR factor score 2 for analysis 1 | -39396.7 | 149940.5 | -90941.2 | -98633.1 | ||
| REGR factor score 1 for analysis 1 | 91342.23 | -90941.2 | 321566.1 | 228683.2 | ||
| CPS % GDP | 99068.06 | -98633.1 | 228683.2 | 248025.5 |
Source: SPSS 26, the author
Table 10, Collinearity Diagnostics
| Model | Eigenvalue | Condition Index | Variance Proportions | |||||
| (Constant) | CPS % GDP | REGR factor score 1 for analysis 1 | REGR factor score 2 for analysis 1 | REGR factor score 3 for analysis 1 | ||||
| 1 | 1 | 1.998 | 1.000 | 0.00 | 0.00 | 0.00 | 0.00 | 0.00 |
| 2 | 1.000 | 1.413 | 0.00 | 0.00 | 0.34 | 0.00 | 0.00 | |
| 3 | 1.000 | 1.413 | 0.00 | 0.00 | 0.00 | 0.00 | 0.73 | |
| 4 | 1.000 | 1.413 | 0.00 | 0.00 | 0.00 | 0.74 | 0.00 | |
| 5 | 0.002 | 29.459 | 1.00 | 1.00 | 0.66 | 0.26 | 0.26 |
Source: SPSS 26, the author
Table 11, Residuals Statistics
| Minimum | Maximum | Mean | Std. Deviation | N | |
| Predicted Value | -1489.2480 | 21832.4395 | 1879.9067 | 6343.7306 | 12 |
| Residual | -1412.565 | 1517.54797 | 1.29615 | 880.35080 | 12 |
| Std. Predicted Value | -0.531 | 3.145 | 0.000 | 1.000 | 12 |
| Std. Residual | -1.280 | 1.375 | 0.000 | 0.798 | 12 |
Source: SPSS 26, the author
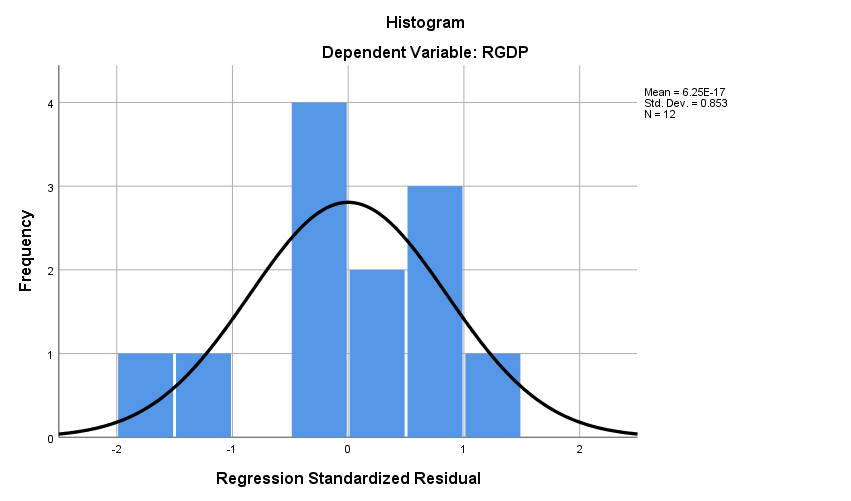
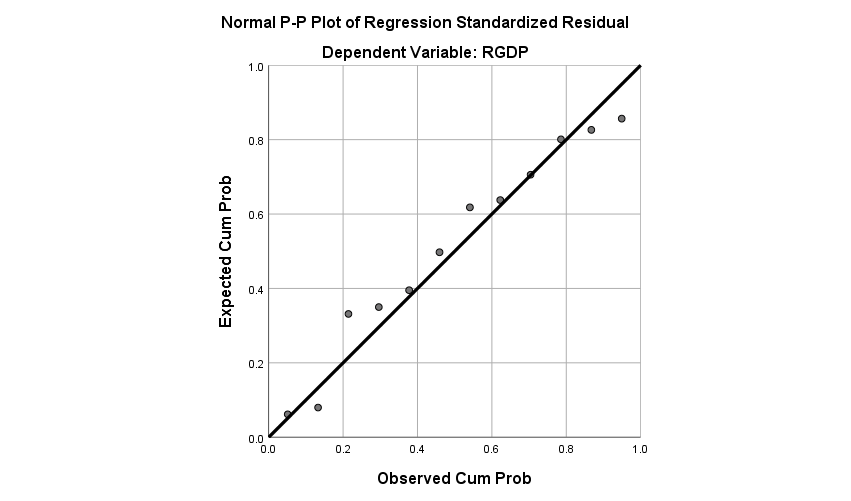
Figure 8, Histogram for Normality Test:
Source: SPSS 26, the author
Source: SPSS 26, the author
- Summary and policy implications:
Financial inclusion has become one of the most crucial issues worldwide since it has several benefits for individuals, financial and business institutions, and economic growth. Additionally, financial inclusion is considered an appropriate financial way to reduce the number of excluded people which indirectly will reduce poverty and income inequality.
To answer the questions and build reliable & sustainable economic policies this paper has applied panel Principal Component Analysis (PCA), and Multiple regression analysis to measure the impact of financial inclusion on the growth of the Sudanese economy during 2006-2020. We used this period due to the unavailability of data such as data related to Automated Teller Machines and the electronic payment methods. Additionally, the emergence of ATMs comes late after 2000. Therefore, we considered 2006-2020 to be suitable and fully enough. Regarding the research methodology and techniques used in this paper, it goes in line with the type of data and variables. Moreover, the Principal Component Analysis is considered one of the appropriate statistical methods to reduce the number of variables that have the smallest variance. Thus, the analysis in Table (5) showed that the first three factors explain the total variance by 87.006% with an Eigenvalue over 1.15%. Also, the Multiple Regression proved the PCA results by showing the significant statistical impact of financial inclusion indices on the growth of the Sudanese economy during 2006-2020. Table (6) revealed that R2 is 0.98 which means that (ATMs, Bank branches, total finance, bank deposits, credit to the private sector, and doing business) are highly correlated, and have a strong influence on the dependent variable economic growth in Sudan. In terms of econometric problems, the results proved that the Multicollinearity problem does not exist as well as the Autocorrelation Problem since Durbin Watson is 1.069, and the Variance Inflation Factor (VIF) is less than five. As for the fitness of the overall model, the Analysis of Variance table (ANOVA) showed that the model is statistically significant and fit which means it can be used for economic policies. Therefore, building on the statistics shown in the analysis, the paper questions are answered, and the hypothesis was accepted means that there is a statistically significant relationship between financial inclusion and economic growth in Sudan. Thus, the paper recommended that the government of Sudan should: Firstly, adopt a cashless financial system to include wages, salaries, and payments. Secondly, enhance the quality of financial services such as lending money to small businesses as well as individuals. Thirdly, increase the number of bank branches per 100.000 persons in urban and cities. Fourthly, total finance and credit to the private sector should target the weaker segments of financially excluded people. This paper will contribute to the literature by focusing on financial inclusion in Sudan and how the policymakers get benefits from the existing literature. It is recommended for the next researchers to focus on the quality of financial inclusion indices as well as the institutional perspective.
References:
Abiola A. Babajide1, F. B. A. A. E. O., 2015. Financial Inclusion and Economic Growth in Nigeria. International Journal of Economics and Financial Issues, 5(3), pp. 1-2.
Anon., 2019. World Bank Data, Washington: World Bank.
Anon., 2020. International Finance Corporation, s.l.: International Finance Corporation.
Corporation, I. F., 2020. s.l.: s.n.
Cyn-Young Park and Rogelio V. Mercado, J., 2015. Financial Inclusion, Poverty, and Income Inequality in Developing Asia. Tokyo, Asian Development Bank economics working paper series, pp. 1-2.
D.A.T, K., 2021. Dimensions of Financial Inclusion, An Individual Perspective. Journal of Accountancy & Finance, 6(2), pp. 41-42.
Faycal Chiad, A. L. a. A. A. a. A. L. S., 2021. Financial Market Inclusion and Economic Growth: Evidence from Algeria. Empirical Economics Letters, 20(10), pp. 1-2.
Gerhard Kling, V. P.-C. L. T. &. D. L., 2022. A theory of financial inclusion and income inequality. The European Journal of Finance,
Ghazi, S. A., 2019. a proposed framework for measuring and interpreting the impact of financial inclusion on achieving inclusive growth in Egypt. Commercial and Financial Studies Journal Tanta University Faculty of Commerce, Issue 1, p. 255.
Karpowicz, I., 2014. Financial Inclusion, Growth and Inequality A Model Application to Colombia. International Monetary Fund, 14(66), pp. 4-5.
Karpowicz, I., 2014. Financial Inclusion, Growth, and Inequality: A Model Application to Colombia. International Monetary Fund, IMF Working Paper Western Hemisphere Department., Issue.
Khedr, S. S. a. A. B., 2018. the importance of financial inclusion in enhancing development. management and accounting studies Journal, 3(2), pp. 1-2.
Kothari, C. R., 1990. research methodology methods and techniques. India ed. India: New Age International Publisher.
Maddala, G., 1992. introduction to Econometrics 2nd edition. 2nd ed. New York: Macmillan Publishing Company.
Nadjim, M., 2022. the effect of financial inclusion on the economic growth in Algeria, Egypt, Tunisia, and Morocco. Mohammed bin Ahmed Wahran University, 18(28), p. 257.
Nguyen, T. T. H., 2020. Measuring financial inclusion a composite FI index for the developing countries. Journal of Economics and Development, 23(1), pp. 3-4.
Olusegun Akanbi, Q. C. M. K., 2020. Sudan selected issues, Washington DC: International Monetary Fund.
Ozili, P. A. A. a. R. S., 2022. Impact of financial inclusion on economic growth: review of existing literature and directions for future research. International Journal of Social Economics, pp. 4-6.
Ozili, P. K., 2020. Theories of financial inclusion. Munich Personal RePEc Archive, pp. 7-9.
Ragab, J. e. B., 2018. computing a composite index for financial inclusion and estimating the relationship between financial inclusion and Gross Domestic Product. Arab Monetary Fund Abu Dhabi, UAE, Issue 45, pp. 7-8.
Ramananda Singh, a. S. R., 2015. Financial Inclusion: A Critical Assessment of its Concepts and Measurement. Asian Journal of Research in Business Economics and Management, Asian Research Consortium, Volume 5, pp. 12-13.
Sulong, H. O. B. a. Z., 2018. the Role of Financial Inclusion on Economic Growth: Theoretical and Empirical Literature Review Analysis. Journal of Business & Financial Affairs, pp. 1-2.
Tuesta, N. C. D., 2014. Measuring Financial Inclusion: A Multidimensional Index, Working Paper, Nº 14/26 Madrid.
