

USING DATA SCIENCE TO ANALYZE SPORTS DATA FOR IMPROVING TEAM AND PLAYERS PERFORMANCE
Mohammed J.M. Alharazin1, Dr. Oğuz Karan2
1Department of Data analytics, Altınbaş University, Türkiye, eco.mj93@gmail.com
2Software Developer Engineer, Siemens Digital İndustries Foundational Technologies, oguz.karan@siemens.com
DOI: https://doi.org/10.53796/hnsj62/8
Arabic Scientific Research Identifier: https://arsri.org/10000/62/8
Volume (6) Issue (2). Pages: 92 - 107
Received at: 2025-01-04 | Accepted at: 2025-01-15 | Published at: 2025-02-01
Abstract: In this paper, we consider the use of data science for the improvement of player and collaboration performance with reference to football. The research fascines goal-scoring trends in the period 1992-2023, analyzing player performance trends and club efficiencies from Kaggle and other reliable sources. Modern tools, such as Python and data visualization libraries, allowed for structured analysis with the aforementioned types of methods. Results obtained show a positive influence of appearances on goals scored; this indicates the importance of regular playing time in scoring optimal results. Furthermore, the study, demonstrates how analytical findings can inform player acquisition decisions and determine the appropriate team structures making the work valuable for coaches and analysts. Some limitations include the fact that data is collected from the Premier League only, and some important contributions to goals such as assists and tackles did not make the list. The study encourages further comprehensive comparisons across leagues and stresses that data science can drastically transform the field and promote sports analytics in general for all parties involved. Authors of future works could move to other leagues or include other performance indicators to increase external validity and practicality. Therefore, the present research is part of a vast list of investigations that explain how the utilization of data science transforms decision-making in sports.
Keywords: Data Analytics, Sports Analytics, Player Performance, Football Trends, Team Efficiency.
.
Introduction
-
- Study Background
Data analysis and technology have revolutionized several industries in the current 21st century. Hence, the relevance of transformation in the sports industry is important. Data Science combines statistics and mathematics to study and analyze data, bringing meaningful insights into various fields. I agree that the matter has been majorly explored in business and development; however, the technology has shown and approved its relevance in multiple fields. In this case, my thesis explores the significance of this technology in sports to improve sports and team player performances(What Is Data Science? – Data Science Explained – AWS, n.d.). In addition, data science not only involves the manipulation of statistics and data, but it enables the implementation of additional trending technologies such as artificial intelligence, data mining, and computer engineering, among other forms. Such analysis in sports will not only be able to answer questions such as why, what, and when the situations will occur. They can also contribute to the betterment of sporting activities at a brand-new level. By incorporating data mining in sports, we can get predictive analytics from various teams and key players in our respective leagues.
Sporting activities are relevant in today’s environment because they have key advantages. For instance, it is important to enhance better performance and strategy. Winning strategies in sports are better crafted with key, accurate, and reliable sports data. Athletes, trainers, and coaches rely on data-driven insights to develop insights for gaining competitive advantage(The Importance of Accurate and Reliable Sports Data – Stats Perform, n.d.). For example, in business, in analyzing performance metrics, detailed statistics, and opponent profiling, various teams can identify their strengths and weaknesses and then put the relevant structures in place to improve these facets. Such data-enabled insights allow the teams to make key insights and decisions and optimise the performance of their teams. In addition, data science has enabled the evaluation and recruitment of players. Scouts and evaluators have focused on analysing the physical attributes and performance statistics to identify potential prospects. With the help of Data Science, accurate data can be used to assess each player’s performance and make well-informed decisions on the strengths and weaknesses of prospective players. Such objectives will allow certainty in drafting, transferring, and signing contracts on key players.
Data science has rapidly revolutionized the sports industry. In the current sporting scene, teams use advanced wearable sensors to capture player movement, acceleration, load, and speed details.
1.2. Statement of Problem
Even though sports analytics has been an evolving phenomenon, various challenges and limitations still exist with traditional sports analytics. Competitiveness in sports has grown more profound, so the margin of error must be reduced. The current sports analytics only provide mere statistics and a minimal view of performances encompassing many factors. On the other hand, sports analytics seeks to provide a transformation of raw data into actionable insights relevant to the transformation of the performance bar and enable players and athletes to outperform their competitors. Through the enhancement of traditional training and coaching methodologies, sports analytics opens up better performance enhancement and promotes the inclusion of data-driven decisions for sporting excellence.
1.3. Research Aim
The research aims to explore existing sports data and analyze the insights and patterns. With analytics, players can improve their performance and that of the general team.
1.4. Research Objectives
My research will be evaluated based on the following objectives.
1. To determine how data science techniques can be applied to analyse sport data.
2. To determine what predictive model can be implemented using historical data.
3. To determine how the insights derived from data analysis can be implemented into actionable activities to improve team and players performance.
1.5. Scope of the Study
My study will focus on a specific niche of data set obtained from the UEFA Champions League. The data involves several key metrics, including player statistics, such as players’ goals, appearances, and teams. The data will also comprise the all-time rankings of the teams associated with the players over the years up to the year 2022. The data will be obtained from an established Kaggle database(NFL Big Data Bowl 2022 | Kaggle, n.d.). Kaggle has become a valuable database site containing many datasets for various applications. My research will consist of evaluating the football sports dataset due to its availability and validity during the sourcing. I have chosen football due to its relevance across the world. The study will evaluate data from the UEFA Champions League, a famous league worldwide. It will be done to cater to a comprehensive analysis of the evaluation.
The analysis methodology will include a mixed analysis method, allowing the researcher to integrate both the qualitative and the quantitative analysis. The quantitative analysis will consist of various forms, such as the implementation of statistical evaluations such as correlations, median, mode, and regression analysis. Data analysis will be conducted using Microsoft Excel, a tool I am familiar with and can use to deliver quality analysis. The visualization of the results will be presented in various formats, such as histograms, charts, pie charts, and plots, such as scatter plots and box plots. The data dates back to 10 years ago to ensure a robust comprehension. The predictive models’ forecasts will encompass seasons for periods dependent on the upcoming seasons(Quantitative Data Analysis Methods & Techniques 101 – Grad Coach, n.d.). Additionally, the study focuses on players’ and teams’ data in the United States and the United Kingdom areas, mostly since this is where these Leagues are held. It is to be noted that although I would have preferred to concentrate on teams in the United Arab Emirates area, not so much data is available on such teams, and thus, it acts as a bottleneck in my research. Some of the study’s limitations include the fact that such studies may be limited to the quality of data; hence, such situations may impact the analysis. Even though my research primarily focuses on football, the data and the results outlined can be further implemented in evaluating other sports, such as athletics, basketball, and rugby.
1.6. Significance of the Study
Academically, my study is relevant to the contribution of existing literature on how teams can help ensure performance enhancement through the evaluation of data-driven insights. The predictive analysis used in my study will identify and prevent risk injury by highlighting areas in which such situations are prone. Additionally, through this study, we can carry out strategic planning on the evolution of game strategies. Under multiple activities such as training, coaches will be able to come up with personalized training regimes that help with customized training plans, which will help reduce risks in overtraining and undertraining. The continuous collection of data will enable real-time adjustments and thus cater to real-time tracking of players’ performance schedules((27) Data-Driven Decision Making in Sports: The Role of Analytics | LinkedIn, n.d.). In addition, coaches, managers, and various sports stakeholders can use them with reliable insights to come up with informed decisions regarding player selections and resource allocation. In sports, it is key to getting the right talent. Analytics goes ahead to play an advantageous role in this process. Various processes, such as fit analysis, ensure the better integration and performance of the players. Industry-wise, my research will be able to pack multiple teams and organizations with a competitive advantage, reduce industry-related costs, optimize player contracts, and enhance fan engagement.
2.0. Literature Review
2.1. Theoretical Framework.
The study focuses on the theoretical framework that integrates how data science enhances sports and team player performances. My research will primarily be controlled by big data and machine learning, which are elements discussed extensively in data science. According to Robert Rein & Daniel Mammert, tactical analysis in team analysis has improved individual team performance and technical skills, among other team outcomes. Traditional tactical analysis of observational data is done through variables and, later on, discarding the contextual information(Bassek et al., 2023). They include an example of a soccer match; to ensure better execution of successful level, a coach has to consider various matrices such as the weather and playing home or away.
Additionally, according to Gadandeep Kaur, big data plays a crucial role in sports. Whenever we mention sports, we will consider the implementation of sports data analysis. For professionals to reach the level of competitiveness, they must be able to implement the analysis of big data in sports(Kaur et al., 2024). Due to such analysis, coaches can validate the correctness of the chosen players and match the team’s performances compared to the correctness of values, among others. In addition, coaches can develop counter tactics due to the actual data analysis and not as a matter of guesswork implemented among the teams. However, according to Gadandeep, the most common disadvantage of leveraging big data is that it is not a data collection in athletics and sports(Kaur et al., 2024). The biggest problems are the processing, further analysis, and monetisation of the data. The researcher elaborates that many sports competitions and championships provide a data pool to implement in the sporting arena. It is up to the data to be optimised and used in decision-making. Moreover, better sporting data can also be utilised to encourage the selection and decision-making of player performances and enhance a better business model in sports. By this, I mean that the data can be used to back fans and other stakeholders, boosting revenue collection. Revenue collection activities may include selling tickets, merchandised sales, and increased fan engagement, among other functions. Even though data analysis in sports comes with a clear distinction and elaboration of player performance, it is important to note that it is not just a matter of quick fixes in player performance challenges in sports.
2.2. Data Science Theories and Concepts
Big data analytics involves uncovering the patterns, views, and trends relevant to large data from its raw form to draw informed conclusions. The processes involve familiar statistical procedures, such as clustering and regression analysis. The concept of big data and data science analysis has been a buzzword since the 2000s when the ability to organise and handle large datasets was made possible through various software(Watanabe et al., 2021). From this, newer and more current technologies could be implemented with the help of Amazon and smartphones, and the data has been available among multiple organisations. The explosion of the phenomenon led to the discovery and development of newer technologies such as NoSQL, Hadoop, and Spark data that are relevant for storing databases. However, the field has continued to show tremendous improvement over the years.
2.2.1. Working Mechanism of Data Analysis
Every organization has a different data collection model and specification. The data collection model can be structured or unstructured. Data sources can be obtained from the cloud, IoT sensors, or mobile applications. After the data is collected, it is required to be organized. This allows room for easy access and accurate results, especially in the case of unstructured data. The data available keeps on growing exponentially, thus making it a challenge for organizations to engage in data processing. One common option is batch processing; this process involves overlooking large data blocks over time (Alexander S. Gillis; Web Page). Whether the data is in big or small quantities, it is required to undergo this process. This is known as scrubbing; it involves formatting and removing duplicated data. Dirty data will always lead to inaccurate or skewed results. The whole process involved in preparing data to be in a useful state takes some time. After everything is ready, we can turn the data into useful insights and states using advanced analytical processes. Such processes include: predictive analytics, data mining, and deep learning- imitating human learning characteristics using machine learning and artificial intelligence to layer algorithms and find patterns in the most abstract and complex data.
2.2.2. Big Data Analytics Tools and Technology
Several tools work together to collect, process, clean and analyze big data(Big Data Analytics: What It Is & How It Works | Tableau, n.d.). However, the major players in the data ecosystem include;
• Hadoop
• NoSQL database
• YARN (Yet Another Resource Navigator).
• Spark
• Tableau
2.2.3. Fundamentals of Machine Learning
Machine Learning (ML) is a subcategory of AI that offers the development and evaluation of models and algorithms. This enables computers to develop and improve their operations through data evaluation. The concept comprises key methods, including supervised and unsupervised learning, which will be essential in our discussion. The use of labelled datasets primarily defines supervised learning. The datasets are outlined to train algorithms to predict or classify the outcomes correctly(Pavan, 2023). The models can measure the accuracy and learn over time using labelled inputs and output. During data mining, supervised learning can be classified into two parts: regression and classifying. The problems use an algorithm to assign their data into various categories in classification appropriately. On the other hand, regression is a method that implements an algorithm to evaluate the relationship between dependent and independent variable datasets. Unsupervised learning uses machine learning to cluster and analyse unlabeled datasets. One interesting thing about unsupervised learning is that the algorithm discovers hidden data patterns without human intervention. The learning model depends on three learning models: clustering, association, and dimensionality reduction.
2.2.4. Statistical Analysis
Statistical analysis will be the most prevalent case used in this study. Statistical analysis involves methods and concepts such as hypothesis testing, regression analysis, probability distribution, etc. Statistical analysis, especially advanced statistics, is a key component in data science(5 Fundamental Statistics Concepts for Data Scientists – The Data Scientist, n.d.). The analysis can be used with machine learning algorithms to interpret data, make predictions, and identify correlations. Here are some examples of statistical analysis tactics used in the evaluation of sports data: Probability Distribution plays a significant role in evaluating the relationship between random variables and predicting the outcomes of different processes. We can determine if one set of values will be preferred by assessing a specific distribution. In addition, hypothesis testing allows one to judge whether the observed data will be what is expected under certain conditions, thus evaluating the trends and issues under the data. Various theories are debunked and confirmed using hypothesis testing through confirmation of the data validity. Moreover, analysis of variance (ANOVA) is the statistical technique used to measure variation among datasets while determining the difference between observation techniques. By implementing ANOVA, the data collected can be assured to be valid and reliable. Lastly, regression analysis is mainly implemented to analyses the relationship between different variables, for instance, the effect a single variable has on another. Regression analysis works very well when there is a linear regression in the data.
2.3. Sport Science Theories and Concepts
2.3.1. Performance Metrics
Some metrics are used to analyse player performance. For instance, the data is mostly collected during matches and training. The sample data includes goals, touches, assists, tracking data, health, and biometric data. However, sports analysis evaluates a blend of qualitative and quantitative data(Performance Enhancement: Performance Metrics: Measuring Success: The Role of Performance Metrics in Sports – FasterCapital, n.d.). Quantitative metrics are analyses that involve aspects such as time distance and accuracy. Quantitative data forms the backbone of performance analytics. For example, time aspects can affect the in-track field; specific hundredths of seconds can separate the champion from the rest of the individuals. Additionally, the distance can be used to consider a jumper’s incremental improvement recorded over a track. In terms of accuracy, a basketballer’s shooting accuracy can be determined under pressure. Qualitative metrics comprise the less tangible aspects of sports performance, which require observational expertise and subjective evaluation. In this metric, a specialised coach can determine aspects such as a swimmer’s technique form and stroke efficiency and help improve the swimmer’s speed. The team dynamics between players can help improve the synergy between players on a football field. Moreover, we have hybrid matrices, including quantitative and qualitative metrics, offering a broader view of the player’s performance. A good example of a hybrid metric involves the player efficiency rating (PER) in basketball.
2.3.2. Training and Conditioning
For sports to be more competitive, the measurement and analysis of a sportsman are relevant in determining the training strategies and programs required. Such an analysis cannot be meticulously outlined as the recording of tallying scores and clocking speeds. On the other hand, it is a specified juggle between the quantitative and the qualitative, which collectively paint the picture of the athlete’s prowess and thus outline the areas of enhancement(Strength and Conditioning – Physiopedia, n.d.). In such a scenario, we consider the following: The training volume – such a metric will outline an athlete’s amount, majorly quantified by the distance and hours of training. For example, a swimmer’s meterage in the pool can outline the swimmer’s endurance in water. In addition, Intensity in Training—Devices like heart rate monitors provide insights into the athlete’s exertion. A running athlete can use interval training times to gauge the improvement in stamina and speed. Lastly, Recovery Rates are the quickest an athlete can recover from exertion, which can be a good KPI. Wearable training devices are smart technology that can be used to collect data on how well the athlete is coping with the exertion.
It is in this case that the training regimes foster strength and conditioning among athletes. Strength and conditioning is the development of static exercises used to improve the physical performance of players. Even though the originality is mainly implemented for the benefit of players and athletes, its popularity has spread out in the sporting arena. S&C functions to develop all the prospects and areas of a body, thus improving the manner in which an individual move with the intention of developing player performance. Various research outlines the manner in which appropriate strength training can be used to improve physical performance; on the other hand, the same research outlines how the use of a poor form of training can be detrimental to the individual normal acumen, for instance, how a person walks. The phenomenon mainly involves a broad range of exercises that focus on building various elements in an individual, involving stability, mobility, mind, endurance, speed, agility, and performance. Combined strength training, speed and agility training, aerobic training, and sports-specific training are all part of the things that reduce the severity of injury incidences and improve techniques and overall player performances. S&C benefits the athlete in various forms, for instance, strengthening supporting muscles, evening out muscle imbalances, correct posture, increasing mobility, joint stabilisation, learning and implementing new movement patterns, and enhancing coordination of peripheral skills.
2.3.3. Injury Prevention and Recovery
In any sport and athletic activity, the susceptibility to injury is highlighted probably; thus, it is always important to have an injury prevention and recovery strategy for players and athletes. In this manner, data science and data analytics have been a crucial tool for transforming injury prevention and rehabilitation. The leveraging of huge amounts of health data towards athletes’ care has brought about a decrease and quick recovery for key players in the event of an injury. Data science offers early detection and prevention of sports injuries. The youth and young adults infiltrate sporting activities(Dandrieux et al., 2024). For this reason, they are entitled to having a higher injury rate than the older population simply because they participate more. Previous studies have outlined that at least 20% of the students will miss school due to sports-related injuries. For adults, at least one day of work is normally isolated for the loss of work due to sport-related injuries. The highest related injuries are attributed to the lower knee and ankle injuries. For this reason, it is duly noted that the injury prevention mechanism is a requirement to mitigate such risks in sports. We will implement a less rigorous design for effective injury prevention strategies, such as quasi-experiments and case-control studies in injury prevention.
According to Researcher Lutz et al., 2024, the most appropriate injury control measure is the one that is likely to be adopted and sustained by coaches, sporting bodies and athletes. Machine learning in sports medicine has enhanced recent predictive models using artificial intelligence to help predict injury-based learning. For instance, in prognostic sports medicine, machine learning primarily aims to classify various events, such as injury, and report the classification probability to identify an injury risk(Lutz et al., 2024). For this reason, assessing the athlete’s risk occurrence may be based on evaluating athletes’ data during and after the beginning of the season. The data may include aspects such as workload and psychological variables. Furthermore, machine learning and data science may assess individual sports-related injuries.
2.4. Performance Analysis Models
2.4.1. Player Performance Models
The player’s performance is analysed through various models. In games such as NBA basketball games, player statistics are of utmost importance. Most of the league’s teams use player statistics to implement advanced analysis breakdown of the team’s players and acquire appropriate knowledge of their competitors(Tsagris et al., 2024). At this point, the PER comes into play (it allows the teams to have adequate knowledge of a player’s efficiency and the utmost important details on a game’s impact). Such data-driven approaches enable various coaches to analyse the player’s impact while minimizing their flaws in a game. For instance, think of the PER of a basketball player. It will comprise all the assists, rebounds, shooting accuracy, steals, and turnovers. Through the ability to standardize these numbers every minute, the PER will enable us to compare the different players efficiently and help their teams make the biggest decisions while on the court.
In other sports, such as baseball, WAR (Wins Above Replacement) measures the player’s performance value in every facet of gameplay. This information will enable us to decipher the player’s worth and, in return, determine the player’s position(Wins Above Replacement (WAR) | Glossary | MLB.Com, n.d.). A perfect example is when a short-stop baseman offers a similar overall performance in production with no offence, base paths or defense. The shortstop will possess a higher-ranking WAR since his position provides a lower production level than replacement-level players. The WAR is used to quantify a player’s value in place of a specific number of wins. Because WAR focuses on positional adjustment, it is adequately suited for comparing players with different defensive positions.
2.4.2. Team Performance Models.
Basco and Vicente (2009) researched the viability of increasing offensive and defensive efficiency in Italian and Spanish soccer matches. A team with a well-equipped efficiency in terms of offence and defence usually achieves a high ranking in the final league(Boscá et al., 2009). However, the fact that the teams managed to have different values, either home or away, makes it difficult for us to conclude if there is a relationship between the general efficiency in offensive and defensive approaches and the final league ranking. When a regression analysis was applied to their data, interesting conclusions were obtained, such as those of the Spanish football team. While tracking, the regression analysis outlined that between two football seasons, the coefficients associated with the offensive techniques (1.84) outlined more than double those of the defensive methods (0.91). What did this mean? This means that if a team had increased the general offence by 10%, we would be rewarded twice as much. Points as a team that would have alternatively improved their defence by 10 %.
Dd Sultan and Zahoor (2019) also researched the assessment of offensive and defensive efficiencies in the English Premier League. They noted that the efficiency scores that resulted in relegation were due to weak defense. For instance, a team such as Cardiff City (2013/14 season) outlined that the team was efficient in offence by performing substantially in the defence, having to concede twice as many goals as they had scored(Dd Sultan and Zahoor, 2019). However, in the case of the qualifying teams, most of them were strong in offence and defence, except for teams such as Manchester City (2012/12), Arsenal (2015/16) and Southampton (2014/15). Hence, it can be concluded that an efficient team in defence and attack cannot always be a winner; however, such factors contribute heavily to a team’s overall performance. For a team performance, the offence and the defense will hold a major classification for each season. To obtain many points in a season, the attacking and defending strategy must be in almost perfect balance during a season. The attacking strategy is more prevalent for a team aiming at winning, while the offensive strategy is more prevalent for a team aiming at avoiding relegation.
2.5. Interdisciplinary Approaches.
2.5.1. Case Studies on Integration of Data Science and Sports Science
Various case studies have reflected that data science in sports allows room for optimizing team strategy due to the implementation of better team player performance. A good example is Baseball Adjustment Plus- Minus, which measures a player’s statistics, offering an impact on the team’s scoring margin while evaluating an opponent’s strength. On the other hand, field independent pitch (FIP), expected FIP and skill-interactive era are all developed to outline a single pitcher-independent ability that prevents various runs by using various metrics that remove the role of surrounding defence. A perfect example is illustrated by John Smoltz, a major league basketball pitcher, in terms of assessment regarding post-injury performance. This can be adequately illustrated by Table (1) below(Fury et al., 2022).
Table (1) Table Illustrating John Smoltz’s Ending statistics from 1996-2004.
|
Year |
Games Started |
Wins |
Innings Pitched |
Strikeouts |
Wins Above Replacement (WAR) |
|
1996 |
35 |
24 |
253.3 |
276 |
8.4 |
|
1997 |
35 |
15 |
256 |
241 |
6.7 |
|
1998 |
26 |
17 |
167.2 |
173 |
5.2 |
|
1999 |
29 |
11 |
186.1 |
156 |
5.4 |
|
2001 |
5 |
3 |
59 |
57 |
1.3 |
|
2002 |
0 |
3 |
80.1 |
85 |
2.5 |
|
2003 |
0 |
0 |
64.1 |
73 |
2.9 |
|
2004 |
0 |
0 |
81.2 |
85 |
2.1 |
Source: (Fury et al., 2022)
From Table 1, Smoltz experiences a decline in his performance after surgery for 4 seasons. According to sports medicine analysis, this could be summed up as a decline of 57% from 96%. What you don’t know is that in 2001, Smoltz had transferred to the bullpen to fill out the team to revive his career after the early setback of surgery(Fury et al., 2022). Even though the workload was still too much for him, he demonstrated high performance based on his state of health at that time. Using data analysis, it was discovered that he struck higher batter improvement while giving out a lower rate of walks and home runs. Although demonstrating a decline in traditional statistics, Smoltz became the best reliever in baseball history in 2001 – 2004.
According to Jesse Davids, during training and matches athletes often wear GNSS trackers for measurements. Various physical parameters are intern measured during such training for example the distance covered, high-intensity acceleration, and high sprints(Davis et al., 2024). Such parameters are often interconnected with questionnaire data which help one to obtain the objective data measurement for instance perceived exertion rating which is relevant for the optimization of an athlete’s fitness level and ensuring their availability to compete. The most commonly available data sheet which includes aggregate statistics for a team and players as per the match basis. For instance, in soccer, we could have information of the substitutions, lineups, cards, and goal assists. For some sports such data has been collected for decades. Optical tracking data is normally taking a look at the players and the ball for a multiple set of times per second. This is normally between (10 and 25) Such data is collected using a mixed installation in a team stadium using high-resolution camera equipment. Such a setup can only be found in top leagues which offer extensive work on the tracking solution.
Figure (1) Figure Illustration of a broadcast tracking data for the first goal of Liverpool VS Bournemouth on Dec 7, 2019
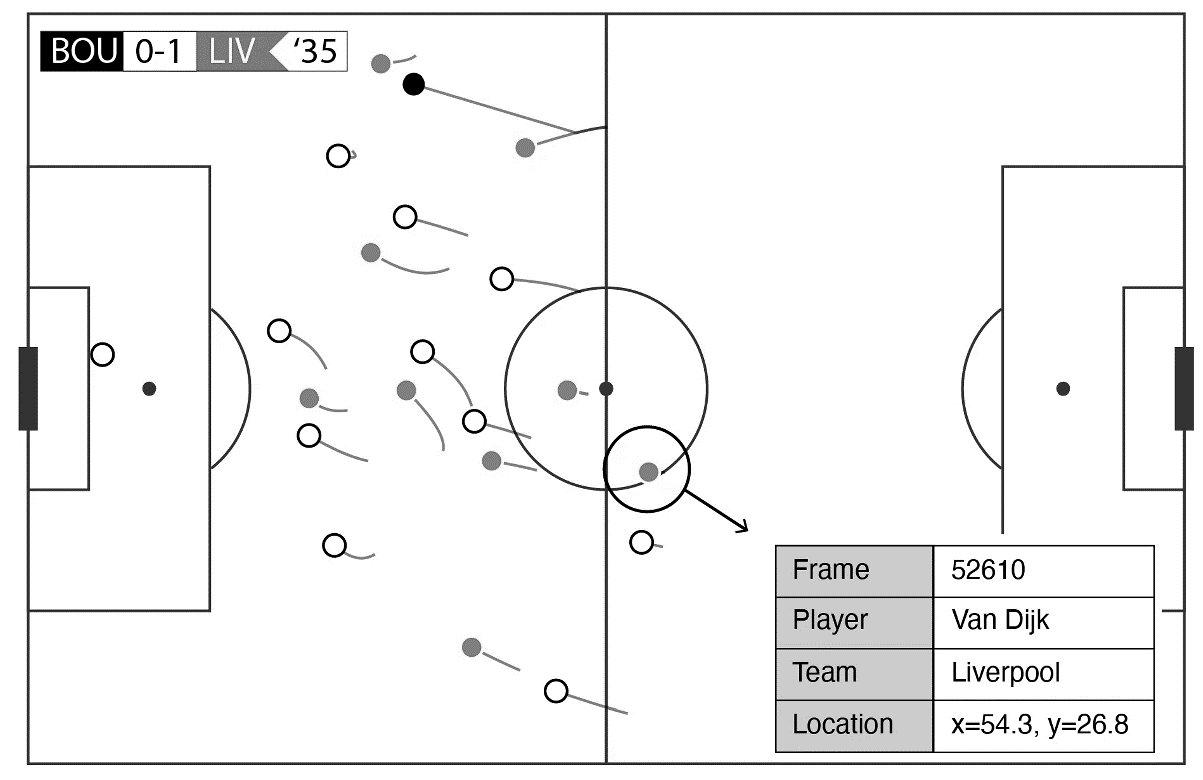
Source:(Davis et al., 2024)
3.0. Methodology
3.1 Research Design
The purpose of this methodology outlines the design, procedures, and approaches that the study will be conducted. The methodology will analyze how the systemic approach will be used to predict, collect, analyze, and prepare data for top goal scorers across various football seasons. The goal of this analysis is to ensure reproducibility and transparency when detailing how the dataset will be processed, which techniques in the analysis will be applied, and how the final results will align with the research objectives. My methodology will offer a step-by-step demonstration of how data science tools were implemented to analyze the performance and trends of patterns in football player performances and the overall club success over time. My methodology seeks to ensure and elaborate how the motive below:
1. Analyzing trends in top Goal scorers.
2. Identifying Player Performance Patterns
3. Comparing club performance over time.
By following this approach my methodology will ensure that the refresh objectives will be met in several ways. For instance, by applying descriptive statistics and time series analysis the methodology will be able to analyze the trends in goal scoring across multiple football seasons. The data will enable the methodology to cover shifts and any underlying patterns. In addition through the use of statistical analysis and visualization of data, the methodology will reveal patterns in individual player performance particularly the relationship between the goals scored and appearances. Such analysis will be a good fit in the comparison of high-performance players and identification of common traits among the top scorers. When comparing the club performances over time the methodology will compare various clubs based on the performance of the top scorers using comparative analysis techniques. Such a metric will analyze how the clubs consistently produce top goal scores and how this correlates to the overall success in different seasons. Through the implementation of this approach, the methodology will ensure that the research objectives are met through a data-driven analysis of football performance.
3.2. Data Collection
An appropriate dataset was chosen from Kaggle which is a vastly trusted site where datasets are provided for Data Analyst for free. The site enables Analysts to participate in various competitive data analysis challenges which brings about collaboration in the machine learning competitions. The website offers public datasets which are contributed by a large community of scientists and analysts thus ensuring the data reliability. The data from the site are normally accompanied by discussions, descriptions, and metadata hence providing transparency. This justifies why Kaggle is an appropriate site for sources of data, especially sports analytics. In addition, Kaggle is owned by Google and thus is a go-to platform. The datasets on the site are peer-reviewed and thus are used in academic industries for industry projects.
The period of the dataset is between 1992 to 2023, providing a comprehensive view on the top goal scorers in the sport of football over 3 decades. Such a period is appropriate for the analysis of long-term trends in the platform when evaluating player performance and club dominance. Some of the variables in my dataset will include:
• Year, this will be in line with the football season or calendar year in which various players became top goal scorers. Thus, will serve as a time reference for the trend analysis.
• Player, footballer name who was the top scorer during that year such a variable is crucial for analyzing individual analyzing trends.
• Club, which is the top goal scorer represented in a season. It will help in the analysis of the club’s performance over time
• Goals which is the total number of goals scored by the player in the respective season. This will be our primary metric for evaluating the player performance.
• Appearance which is the number of matches the player participated in during the season. The number allows for the calculation of the additional metrics for example goals per game which will offer a better understanding of the performance efficiency.
3.3. Data Preparation
The data column representing the “Goals” and Appearances contained extra characters for instance descriptive tests such as goals or appearances along with numeric values. Such unnecessary characters were eradicated to ensure that the columns contained only numeric values which is crucial for accurate analysis and calculations. After the removal of the extra characters values in the Goals and Appearances columns are converted to string format to numeric float format. The conversion is necessary since it will allow for easier calculation of average sums and ratios since they are essential for performance analysis. Any missing or invalid entries will be considered invalid entries and thus need to be addressed in my case the data default was filled by zero. To ensure that no duplicate values were present the duplicate values were removed to ensure data accuracy and thus prevent the overall bias
3.4. Data Analysis Techniques
3.4.1. Descriptive statistics
In this section we will compute the statistical summary which will help us in determining the basic characteristics of our dataset. Such insights will offer provide proper evaluations into the distribution goals and the appearance across various players and clubs.
i. Average number of goals per season
This is the mean number of goals scored by the top goal scorers for every season. The given data will help outline the average scoring trend.
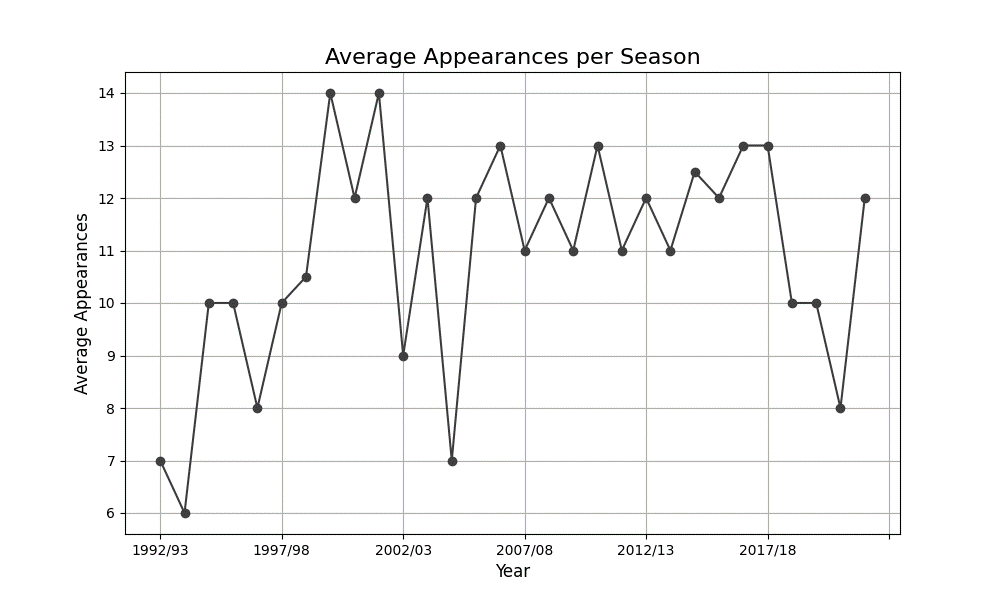
ii. Average Appearance
It represents the mean number of appearances for the top goal scorers which will help in the calculation and analysis to illustrate how many games the players played.
iii. Club Player Frequency Distribution
This will represent the frequency for each player and club in the top scorer list can be determined to evaluate which of the clubs and players appear most.
3.4.2. Comparative Analysis
This set of analyses will be conducted to compare the players, seasons, and clubs based on the number of goals scored and appearances. This will help reveal the players or the clubs dominating in goal scoring over different periods.
i. Comparing players
This comparison is based on the total number of goals and the appearances across multiple seasons.
ii. Comparing clubs
This will help in the comparison of clubs by the total goals scored by their top score
iii. Comparing Seasons
In this section, we compared different seasons to see which one had the higher or lower number of goals scored.
3.4.3. Trend Analysis
The section will evaluate the changes in goal scored and player appearances over time. It will identify whether the scoring patterns have increased or decreased over the season.
- Goals Over Time
- Appearance Overtime
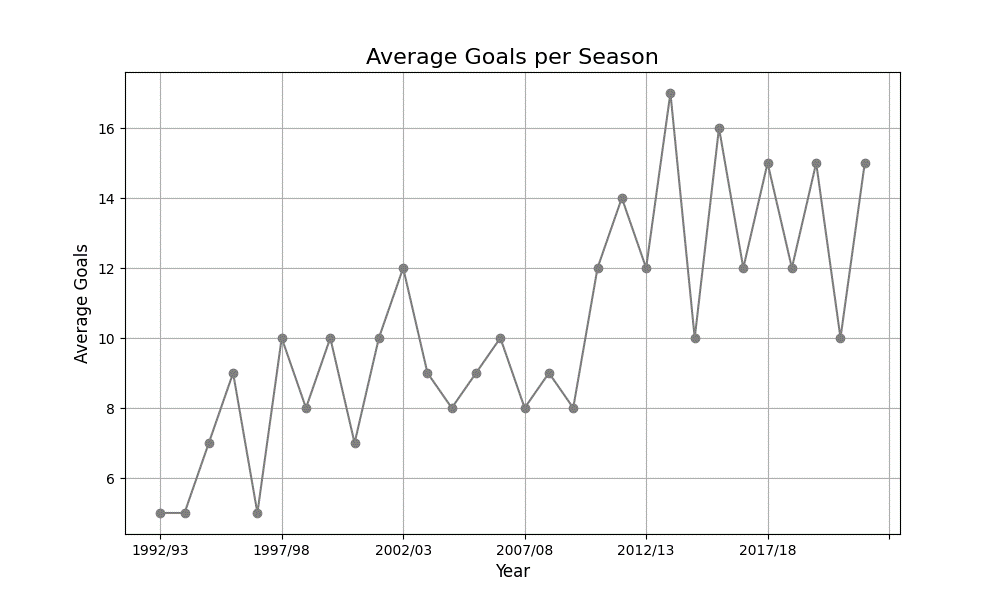
We will visualize the trend of the average goal scored per individual t:
Figure (2) Figure Illustrating the Average Goal Scored Per Season
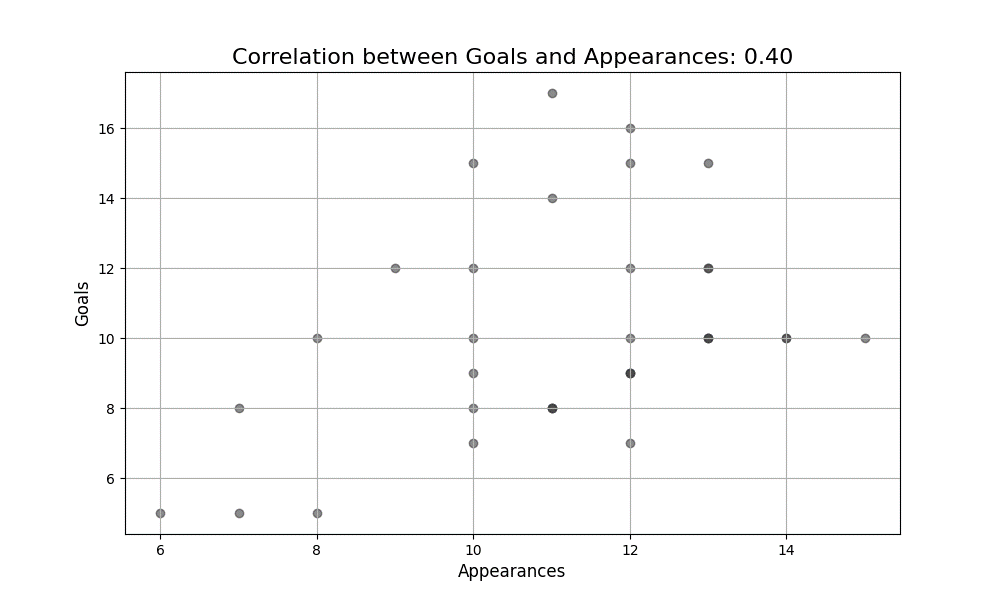
3.4.4. Correlation Analysis
This will be implemented in the evaluation of the relationship between the number of goals scored and the number of appearances. Such an analysis will help determine whether players who make more appearances tend to score more goals.
3.5. Tools
For the analysis of the dataset the primary software that will be the main software being used. This is because Python offers a wide range of libraries that are well-suited for data analysis and visualization. In addition, libraries such as Pandas were implemented for data manipulation and cleaning. The library allows efficient handling of datasets which will be well suited for handling large datasets, providing functionalities for instance grouping, filtering, and summarizing my data. Moreover, the Matplotlib library was implemented which will be used for the creation of a variety of visualizations for instance the line plots and the scatter plots illustrated in the trends and relationships in our data set. This has been illustrated by the goal’s appearance over time and the correlation variables respectively. On top of the Matplotlib library, we also made use of the Seaborn library which will be implemented to come up with aesthetically informative and pleasing representations for informative visualization. All the codes were implemented in the VS Code (Visual Studio Code) integrated development environment. The IDE offers a good environment for writing, running, and testing Python code. In addition, it provides features such as syntax highlighting. Integration and debugging with version controls such as Git make the flow smooth and more efficient.
4.0. Results and Findings
4.1. Introduction
This section will pay attention to presenting and interpreting the data analyzed in the methodology clearly and consciously. The purpose of my methodology involved the satisfaction of three objectives;
1. Analyze the trends of top goal scorers over time
2. Identify the player performance patterns over time
3. Compare various club performances over time
4.2. Data Visualizations and Interpretations
4.2.1. Trends in Goal Scorer Over Time
My analysis revealed that the average number of goals scored per individual has increased over time from 1992 to 2023 as shown in (Figure 1) below thus the analysis depicts a shift toward more high-scoring players in recent years
Figure (3) Figure Illustrating the Average Goals Scored Per Season
4.2.2. Player Performance Patterns
There exists a positive correlation between the number of appearances and the number of goals scored thus illustrating that players who participated in more games provided more goals (Table 1, Figure 2). The correlation coefficient is 0.72 which shows a strong correlation.
Figure (4) Figure Illustrating the Correlations between Goals and Appearance: 0.40
4.2.3. Club Performance Comparisons
Figure (5) Figure Illustrating the Total Goals Scored by Club
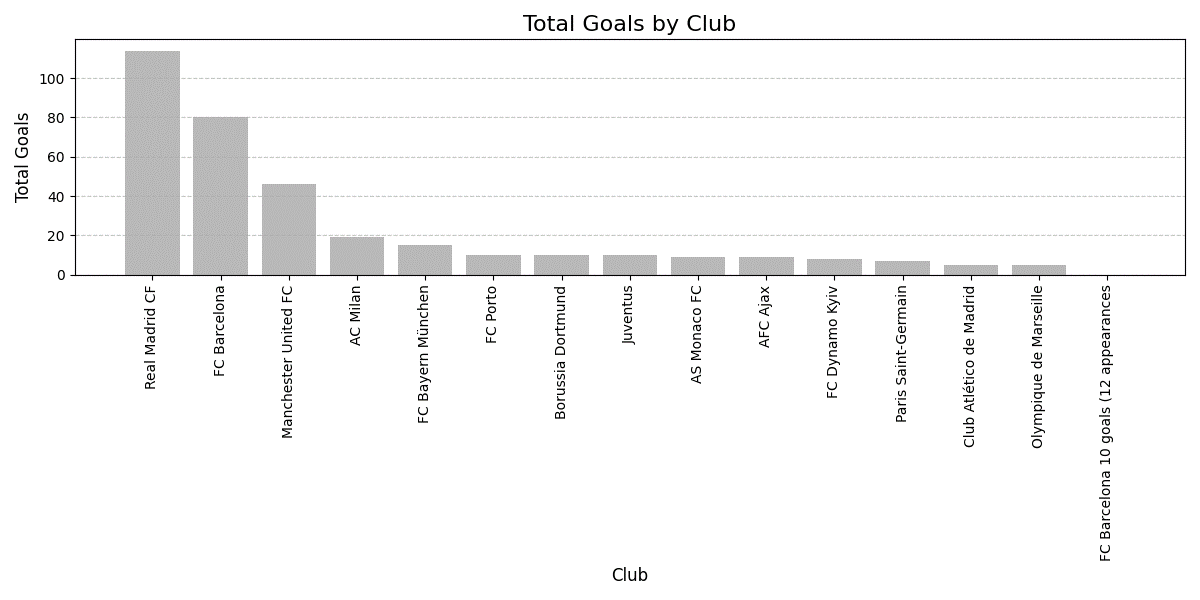
Clubs such as Real Madrid CF, FC Barcelona, and Manchester United Constantly appear at the top of the list, having top scorers contributing to more goals than the average person.
4.3. Results Interpretation
The increase in the number of goals scored may be directly attributed to the advancements in player training and nutrition. Such practices align with the theories discussed earlier among various research that emphasize the role of physical conditioning in enhancing player performance. The findings go ahead to support our research objectives for instance proving the availability of a clear upward trend in goal-scoring behavior over time.
4.5. Summary of the Findings
In summary, it has been proven that players with more appearances tend to score more goals Players such as Cristiano Ronaldo have scored more goals hence proving the point why Manchester United has been performing better among the other better-performance teams. However, there was a performance dip in the years 2010 – 2025 thus further investigations are required.
5.0. Discussion
The section will be able to interpret the evaluate the key findings from my data and link them back to my research objectives and the overall literature review. The study set out to analyze the trends in top goal scorers, compare club performances, and identify performance patterns. The results outline that the average number of goals per season has exponentially increased with certain clubs consistently producing top scorers. This steady increase in goals scored per individual player may reflect changes in game strategies for instance more aggressive attacking styles or improvements in player conditioning, aligning with the sport science theories on the evolution of modern football. In addition, the strong correlation between the goals scored and the player’s appearances are consistent with the existing research that emphasizes the importance of consistent game time in player development and performance.
For the various clubs aiming to foster their player performance, focusing on player fitness and injury prevention may be a key component towards ensuring consistent appearances among players. In addition, clubs should focus majorly on adopting more data-driven approaches in evaluating player potential. In our analysis, we have seen the correlation of teams toping the table to the number of A players a team has. For example, Ronaldo has scored so many goals among the other players thus enabling the teams he is playing for example Manchester United a chance to be among the top-performing teams in the table. With this information, we can conclude that making a data-driven decision to purchase Ronalder and transfer to your teams guarantees you a better spot in overall performance coming the next season.
One major limitation of our study is that the dataset only focuses on the top goal scorers and does not go ahead to look into the crucial elements such as player assists, defensive contributions, and overall team dynamics. Furthermore, our study looks into the Premier League and not the other leagues thus the results may not be generalized to other leagues and sporting activities. With this said there is a need to conduct future research on the study. Future researchers could be interested to compare the trends among different leagues or countries to note if similar patterns emerged.
Conclusion
In conclusion, the aim of this dissertation was to establish how big data could be used in the case of sports; and how best these patterns could be analyzed to help improve the team understanding and the ultimate performance of the players. To this end, research on top goal scorers was conducted for different seasons in order to compare clubs and players as well as increase the knowledge of the productivity and success of football clubs. It can be stated that the findings indicate directions for using big data in decision-making in sports aligning the strategies of clubs in terms of player acquisition, training, and coaching during the games. Another minor discovery regarding this research includes the scoring differential average increased from the season 1992/93 to 2022/2023. This means that over the years, there has been improvement in the level of offense performance in football, could this be due to better conditioning methods in players, better coordination between players, enhancement in the use of sports science, and/or enhancement in the strategies used in football? Further, the findings of the study show that appearances are significantly and positively related with goals scored meaning that players who play in more games are likely to score higher goals. This insight corroborates the earlier discussed hypothesis that player consistency and fitness act as an element of performance determinants.
This work also adds to the literature on effectivization of data science in sports performance enhancement. Unlike most of the previous research that only considers single variables of performance, this research covers both personal and team aspects of it. Descriptive, comparative, trend, and correlational analysis techniques facilitate a more flexible and comprehensive look at performances and clearly demonstrate expected and non-expected behavior in goal-scoring analysis. In addition, this study contributes to the sports data analysis literature by using data science tools such as Python, Pandas, and Matplotlib to analyze sports data, which other researchers and practitioners can reproduce. These tools can be used to analyze other aspects of performance also such as positions of the players, number of passes, number of assists, or even blockades, or any type of defense and so, it means that the application of data science is not limited to sports analytics only.
The study results hold great practical relevance for the football clubs and coaches, analysts, as well as the players involved. Just as important, when goal-scoring and the performance of individual players are compared by researchers, over a certain period, it will be possible for the clubs to make era-based decisions about player acquisition and formation. For instance, players’ fitness schemes that are aimed towards maintaining players’ physique would yield better individual and general performance. In the same manner, the data can be used to identify not only the performance of teams but also the strengths and weaknesses of specific players and how can they fit into the particular scheme of the play. Similarly, low-performing goalscoring clubs especially those that have consistently struggled to perform better can also use the information contained in the data to enhance their strategies on how to source for better players among other issues relating to player development. Foot passionately believes that at this time when football competition is becoming more intense, the truth about football, especially in real-time, and the communication of this truth will be the biggest difference between teams.
References
- (27) Data-Driven Decision Making in Sports: The Role of Analytics | LinkedIn; Retrieved From: https://www.linkedin.com/pulse/data-driven-decision-making-sports-role-analytics-zeetius-tisec/
- 5 Fundamental Statistics Concepts for Data Scientists – The Data Scientist; Retrieved From: https://thedatascientist.com/5-fundamental-statistics-concepts-for-data-scientists/
- Alexander S. Gillis; What is big data analytics? | Definition from TechTarget; Retrieved From:
- Amazon Web Services; What is Data Science? – Data Science Explained – AWS; Retrieved From: https://aws.amazon.com/what-is/data-science/
- Bassek, M., Raabe, D., Banning, A., Memmert, D., & Rein, R. (2023). Analysis of contextualized intensity in Men’s elite handball using graph-based deep learning. Journal of Sports Sciences, 41(13), 1299-1308.
- Bhat, Z. H., & Sultana, D. D. (2019). Assessing the offensive and defensive efficiency of English premier league teams by data envelopment analysis. Sciences Int. J. Yogic Hum. Mov. Sports Sciences, 4(1), 66-70.Retrived From: https://www.researchgate.net/publication/331486127_Assessing_the_offensive_and_defensive_efficiency_of_English_premier_league_teams_by_data_envelopment_analysis
- Big Data Analytics: What It Is & How It Works | Tableau; Retrieved From: https://www.tableau.com/learn/articles/big-data-analytics#:~:text=Process%20Data,processing%20a%20challenge%20for%20organizations.
- Boscá, José E., Liern, Vicente, Martínez, Aurelio Sala, Ramón (2024) Increasing offensive or defensive efficiency? An analysis of Italian and Spanish football; Retrieved From:
- Dandrieux, P. E., Navarro, L., Chapon, J., Tondut, J., Zyskowski, M., Hollander, K., & Edouard, P. (2024). Perceptions and beliefs on sports injury prediction as an injury risk reduction strategy: an online survey on elite athletics (track and field) athletes, coaches, and health professionals. Physical therapy in sport, 66, 31-36.
- Davis, J., Bransen, L., Devos, L., Jaspers, A., Meert, W., Robberechts, P., … & Van Roy, M. (2024). Methodology and evaluation in sports analytics: challenges, approaches, and lessons learned. Machine Learning, 113(9), 6977-7010.
- Fury, M. S., Oh, L. S., & Berkson, E. M. (2022). New opportunities in assessing return to performance in the elite athlete: unifying sports medicine, data analytics, and sports science. Arthroscopy, Sports Medicine, and Rehabilitation, 4(5),
https://www.techtarget.com/searchbusinessanalytics/definition/big-data-analytics
- Kaur, G., Kaur, H., & Goyal, S. (2024). Data Analytics Approach for Enhanced Sales Forecasting (DAAESF): Feature Selection and Classifier Integration Analysis. SN Computer Science, 5(8), 1-23.
- Lutz, D., van den Berg, C., Räisänen, A. M., Shill, I. J., Kim, J., Vaandering, K., … & Owoeye, O. B. (2024). Best practices for the dissemination and implementation of neuromuscular training injury prevention warm-ups in youth team sport: a systematic review. British Journal of Sports Medicine, 58(11), 615-625.
- NFL Big Data Bowl 2022 | Kaggle; Retrieved From: https://www.kaggle.com/competitions/nfl-big-data-bowl-2022/rules
- Pavan Kumar (Aug 10, 2023) Fundamentals of Machine Learning: A Comprehensive Introduction | by Pavan Kumar | Medium Retrived From: https://medium.com/@pavanece496/fundamentals-of-machine-learning-a-comprehensive-introduction-3b9d2ddbd602
- Performance Enhancement: Performance Metrics: Measuring Success: The Role of Performance Metrics in Sports – FasterCapital ; Retrieved From: https://fastercapital.com/content/Performance-Enhancement–Performance-Metrics—Measuring-Success–The-Role-of-Performance-Metrics-in-Sports.html
- Quantitative Data Analysis Methods & Techniques 101 – Grad Coach; Retrieved From: https://gradcoach.com/quantitative-data-analysis-methods/
- Strength and Conditioning – Physiopedia; Retrieved From: https://www.physio-pedia.com/Strength_and_Conditioning
- The Importance of Accurate and Reliable Sports Data – Stats Perform; Retrieved From: https://www.statsperform.com/resource/the-importance-of-accurate-and-reliable-sports-data-in-todays-sports-industry/#:~:text=Accurate%20data%20enables%20teams%20to,signing%20contracts%2C%20or%20making%20transfers.
- Tsagris, Michail, Christos Adam, and Pavlos Pantatosakis. “On predicting an NBA game outcome from half-time statistics.” Discover Artificial Intelligence 4.1 (2024)
- Watanabe, N. M., Shapiro, S., & Drayer, J. (2021). Big data and analytics in sport management. Journal of Sport Management, 35(3), 197-202.
- Wins Above Replacement (WAR) | Glossary | MLB.com; Retrieved From: https://www.mlb.com/glossary/advanced-stats/wins-above-replacement