

Measurement and predication of density and viscosity for binary mixtures n-hexane + n-octane by using PVT system
Abdualnaser M. Almagrbi1, Walid A. Alaswad2, Hana O. Ben Oun3
1,2Chemical And Petroleum Engineering, Elmergib University, Alkhmos, Libya
3Chemical Engineering, Tripoli University, Tripoli, Libya
Email Addresses:
a.muftah@yahoo.com (Almagrbi), walaswadzo@gmail.com (Alaswad),
Hanaown82@yahoo.com (Ben Oun)
HNSJ, 2021, 2(12); https://doi.org/10.53796/hnsj21234
Published at 01/12/2021 Accepted at 23/11/2021
Abstract
In this e work presented the viscosity and liquid density for binary mixtures of hydrocarbon system are measured at different temperatures from 40 °C up to 120 °C and 100 psig to 4000 psig pressure (n-hexane + n-octane). The measured results are used to predict the fluid properties, density &viscosity.
Equipment:
In this work used PVT Model 3000 GL Where used for measurement of Viscosity and Density at different pressures and Temperatures above bubble point pressure to hens the liquid phase reign
PVT Model 3000 GL:
A Precision, Multi-Tasking Instrument For Understanding The Behavior Of Complex Mixtures. The study of thermo-physical properties of fluids such as phase behavior, density, viscosity, etc. under varying conditions of pressure, temperature and volume is commonly known as PVT studies. The Model 3000 PVT System is a precision instrument used
to perform PVT studies on a variety of fluids with a special emphasis on those fluids typically encountered in petroleum reservoirs.
Model 3000 GL is supply with electrical viscometer and densometer at high pressure and temperature measurement; Where used for measurement of Viscosity and Density at different pressures and Temperatures above bubble point pressure to hens the liquid phase reign.
The mPDS 2000V3 is a powerful processor and display unit, designed for the continuous density and concentration measurement in industrial processes. The mPDS 2000V3 can be connected to an Anton Paar DPR(n), SPR(n), Carbo, DSRn transducer or a DMA-HPM high pressure cell. The measured values from these transducers are transmitted via a twin core shielded-cable to the evaluation unit mPDS 2000V3. The evaluation unit determines the concentration for external display or output and control purposes.
The viscometer is made up of a sensor and the operating electronics. The following sections will cover the basic operation of each.
Sensor Overview
The SPL440 sensor is the perfect choice for measuring samples under pressure at temperatures from -40C to +190C. The sensor contains two magnetic coils and an internal temperature detector mounted to the base of the Inconel-718 R measurement chamber. it is designed for continuous operation at 20,000 PSI. With the optional thermal jacket, the sensor temperature can be precisely maintained for accurate viscosity measurements.
High temperature, high pressure (HTHP) volume translated – (VT) EOS.
To predict density used Peneloux [10] introduced a simple method based on the volume translation principles in order to improve the estimation of the liquid molar volume by cubic EOSs.
The high temperature, high pressure volume translated forms of the PR EOS, referred as HTHP VT -PREOS, are presented here.
HTHP VT-PR EOS:
HTHP VT-PR EOS:
Where
3.3 Extension to mixtures
The HTHP VT-SRK EOS and HTHP VT-PR EOS can be extended to mixtures using the following mixing rule proposed in other volume-translated cubic EOS models [15] :
For an n compound mixture the c parameter is obtained using a linear mixing rule
The friction theory ( f-theory) viscosity modeling
The theory for viscosity modeling called the friction theory ( f-theory) has been introduced [1]. According to the f-theory, the total viscosity η of dense fluids can be separated into a dilute gas term η0 and a friction term ηf
By analogy with the Amontons–Coulomb friction law, the viscosity friction term has been linked to the van der Waals repulsive pressure term pr and the attractive pressure term pa by means of three temperature dependent friction coefficients as follows:
(7)
Predicting the dilute gas viscosity of several polar and non-polar fluids within an uncertainty of 1.5%. The model is given by
n -Alkane mixtures:
where the subscript m,x indicates the corresponding mixture property. Here, the mixture dilute gas limit is calculated by:
the subscript i refers to the corresponding pure component of an n components mixture. The mixture friction contribution term is given by
whereare the viscous friction coefficients for the mixture[3]
Results and Discussion
The experimental viscosities and densities of binary mixtures n-hexane + n-octane have been measured at different temperatures and different pressure range between 40 C up to 120 C &100psig up to 4000 psig. The comparisons of some results with literature data for pure n-hexane and nitrogen are presented in Table1.Generally, agreement between experimental and literature data is good.
Calibration of data for the Dens meter
The dens meter has been calibrated with n –hexane, nitrogen, purity ≥ 99%), since table 1 shown data have been reported in the literature for this alkane [13, 14]
Table (1) Comparison of measured Densities (gm/cm3) for pure component n-Hexane with literature
| T (C)
n-Hexane P (psig) |
40 | 60 | ||
| EXP. | Meas. Lit(14) | EXP. | Meas. lit(14) | |
| 4000 | 0.684802 | 0.670665 | 0.667409 | 0.653357 |
| 3500 | 0.681300 | 0.667528 | 0.664523 | 0.649784 |
| 3000 | 0.678280 | 0.664081 | 0.660996 | 0.64576 |
| 2500 | 0.675274 | 0.660607 | 0.657530 | 0.641713 |
| 2000 | 0.671783 | 0.657108 | 0.653991 | 0.638235 |
| 1500 | 0.669205 | 0.653405 | 0.650296 | 0.635295 |
| Nitrogen | lit(13) | lit(13) | ||
| 4000 | 0.26559 | 0.27325 | 0.248361 | 0.25484 |
| 3500 | 0.239008 | 0.24433 | 0.223126 | 0.22755 |
| 3000 | 0.210093 | 0.21364 | 0.19589 | 0.19876 |
| 2500 | 0.178848 | 0.1812 | 0.166662 | 0.16848 |
| 2000 | 0.146058 | 0.14708 | 0.136094 | 0.13677 |
| 1500 | 0.111457 | 0.11147 | 0.103942 | 0.10376 |
Table (2) Densities (gm/cm3) for binary mixtures of 80% n- Hexane (1) +20% n-Octane (2)
| t⁰c
p PSIG |
40 | 60 | 100 | 120 |
| 4000 | 0.6882 | 0.6730 | 0.6401 | 0.6257 |
| 3500 | 0.6853 | 0.6697 | 0.6353 | 0.6200 |
| 3000 | 0.6823 | 0.6664 | 0.6304 | 0.6144 |
| 2500 | 0.6794 | 0.6631 | 0.6256 | 0.6087 |
| 2000 | 0.6764 | 0.6598 | 0.6207 | 0.6031 |
| 1500 | 0.6735 | 0.6565 | 0.6159 | 0.5974 |
| 1000 | 0.6705 | 0.6532 | 0.6110 | 0.5918 |
| 500 | 0.6676 | 0.6499 | 0.6062 | 0.5861 |
| 250 | 0.6661 | 0.6483 | 0.6038 | 0.5833 |
| 100 | 0.6652 | 0.6473 | 0.6023 | 0.5816 |
Table (3) Densities (gm/cm3) for binary mixtures of 20% n- Hexane (1) +80% n-Octane (2)
| t⁰c
p PSIG |
40 | 60 | 100 | 120 |
| 4000 | 0.7141 | 0.7004 | 0.6700 | 0.6525 |
| 3500 | 0.7114 | 0.6979 | 0.6661 | 0.6483 |
| 3000 | 0.7086 | 0.6953 | 0.6621 | 0.6440 |
| 2500 | 0.7059 | 0.6927 | 0.6582 | 0.6398 |
| 2000 | 0.7033 | 0.6902 | 0.6542 | 0.6355 |
| 1500 | 0.7006 | 0.6876 | 0.6503 | 0.6312 |
| 1000 | 0.6979 | 0.6850 | 0.6463 | 0.6270 |
| 500 | 0.6953 | 0.6825 | 0.6424 | 0.6227 |
| 250 | 0.6939 | 0.6812 | 0.6404 | 0.6206 |
| 100 | 0.6931 | 0.6804 | 0.6392 | 0.6193 |
Table (4) Densities(gm/cm3) for binary mixtures of 60% n- Hexane 1) +40% n-Octane (2)
| t⁰c
p PSIG |
40 | 60 | 100 | 120 |
| 4000 | 0.6985 | 0.6817 | 0.6514 | 0.6377 |
| 3500 | 0.6954 | 0.6786 | 0.6467 | 0.6322 |
| 3000 | 0.6925 | 0.6755 | 0.6419 | 0.6268 |
| 2500 | 0.6893 | 0.6724 | 0.6372 | 0.6213 |
| 2000 | 0.6862 | 0.6693 | 0.6324 | 0.6159 |
| 1500 | 0.6854 | 0.6662 | 0.6277 | 0.6104 |
| 1000 | 0.6806 | 0.6631 | 0.6229 | 0.6050 |
| 500 | 0.6773 | 0.6600 | 0.6182 | 0.5995 |
| 250 | 0.6760 | 0.6585 | 0.6158 | 0.5968 |
| 100 | 0.6751 | 0.6576 | 0.6144 | 0.5952 |
Table (5) Densities(gm/cm3) for binary mixtures of 40% n- Hexane (1) +60% n-Octane (2)
| t⁰c
p PSIG |
40 | 60 | 100 | 120 |
| 4000 | 0.7054 | 0.6926 | 0.6609 | 0.6461 |
| 3500 | 0.7027 | 0.6893 | 0.6567 | 0.6415 |
| 3000 | 0.6999 | 0.6860 | 0.6525 | 0.6368 |
| 2500 | 0.6972 | 0.6827 | 0.6483 | 0.6322 |
| 2000 | 0.6944 | 0.6794 | 0.6441 | 0.6275 |
| 1500 | 0.6917 | 0.6761 | 0.6399 | 0.6229 |
| 1000 | 0.6889 | 0.6728 | 0.6357 | 0.6182 |
| 500 | 0.6862 | 0.6695 | 0.6315 | 0.6136 |
| 250 | 0.6848 | 0.6678 | 0.6294 | 0.6113 |
| 100 | 0.6840 | 0.6668 | 0.6282 | 0.6099 |
Table (6) viscosities (Cp) for binary mixtures of 80% n- Hexane (1)+ 20% n-Octane (2)
| t⁰c
p PSIG |
40 | 60 | 100 | 120 |
| 4000 | 0.3942 | 0.3271 | 0.2268 | 0.2106 |
| 3500 | 0.3814 | 0.3170 | 0.2193 | 0.2037 |
| 3000 | 0.3687 | 0.3069 | 0.2119 | 0.1968 |
| 2500 | 0.3559 | 0.2968 | 0.2044 | 0.1899 |
| 2000 | 0.3432 | 0.2867 | 0.1970 | 0.1830 |
| 1500 | 0.3304 | 0.2766 | 0.1895 | 0.1761 |
| 1000 | 0.3177 | 0.2665 | 0.1821 | 0.1692 |
| 500 | 0.3049 | 0.2564 | 0.1746 | 0.1623 |
| 250 | 0.2986 | 0.2513 | 0.1709 | 0.1589 |
| 100 | 0.2947 | 0.2483 | 0.1687 | 0.1568 |
Table (7) viscosities (Cp) for binary mixtures of 60% n- Hexane (1)+ 40% n-Octane (2)
| t⁰c
p PSIG |
40 | 60 | 100 | 120 |
| 4000 | 0.4279 | 0.3590 | 0.2635 | 0.2359 |
| 3500 | 0.4156 | 0.3479 | 0.2551 | 0.2286 |
| 3000 | 0.4033 | 0.3368 | 0.2467 | 0.2213 |
| 2500 | 0.3911 | 0.3257 | 0.2383 | 0.2140 |
| 2000 | 0.3788 | 0.3146 | 0.2299 | 0.2067 |
| 1500 | 0.3665 | 0.3035 | 0.2215 | 0.1994 |
| 1000 | 0.3542 | 0.2924 | 0.2131 | 0.1921 |
| 500 | 0.3419 | 0.2813 | 0.2047 | 0.1848 |
| 250 | 0.3358 | 0.2758 | 0.2005 | 0.1812 |
| 100 | 0.3321 | 0.2724 | 0.1980 | 0.1790 |
Table (8) viscosities (Cp) for binary mixtures of 40% n- Hexane (1)+ 60% n-Octane (2)
| t⁰c
p PSIG |
40 | 60 | 100 | 120 |
| 4000 | 0.4943 | 0.4031 | 0.2761 | 0.2505 |
| 3500 | 0.4793 | 0.3928 | 0.2665 | 0.2420 |
| 3000 | 0.4644 | 0.3825 | 0.2569 | 0.2335 |
| 2500 | 0.4494 | 0.3722 | 0.2473 | 0.2250 |
| 2000 | 0.4345 | 0.3619 | 0.2377 | 0.2165 |
| 1500 | 0.4195 | 0.3516 | 0.2281 | 0.2080 |
| 1000 | 0.4046 | 0.3413 | 0.2185 | 0.1995 |
| 500 | 0.3896 | 0.3310 | 0.2089 | 0.1910 |
| 250 | 0.3821 | 0.3259 | 0.2041 | 0.1868 |
| 100 | 0.3776 | 0.3228 | 0.2012 | 0.1842 |
Table (9) viscosities (Cp) for binary mixtures of 20% n- Hexane (1)+ 80% n-Octane (2)
| t⁰c
p PSIG |
40 | 60 | 100 | 120 |
| 4000 | 0.5229 | 0.4225 | 0.3154 | 0.2707 |
| 3500 | 0.5078 | 0.4117 | 0.3062 | 0.2611 |
| 3000 | 0.4927 | 0.4008 | 0.2971 | 0.2514 |
| 2500 | 0.4777 | 0.3899 | 0.2879 | 0.2417 |
| 2000 | 0.4626 | 0.3790 | 0.2788 | 0.2320 |
| 1500 | 0.4475 | 0.3681 | 0.2696 | 0.2224 |
| 1000 | 0.4325 | 0.3572 | 0.2605 | 0.2127 |
| 500 | 0.4174 | 0.3463 | 0.2513 | 0.2030 |
| 250 | 0.4098 | 0.3408 | 0.2468 | 0.1982 |
| 100 | 0.4053 | 0.3376 | 0.2440 | 0.1953 |
The new volume translated equations of state, the HTHP VT -PR EOS, is used in this work to predict the density of binary mixtures n-hexane + n-octane in the range of temperatures from ~ 40 to 120 C and pressures from ~ 100 to 4000 PSIG.
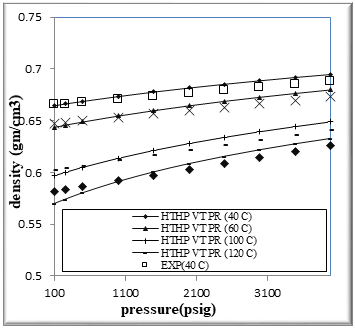
Figure (1) Comparison of density Experimental with HPHT VT PR EOS for binary mixtures of 20% n-Octane (1) + 80% n- Hexane (2)
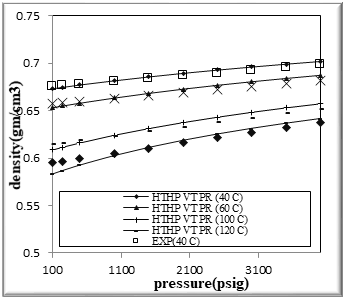
Figure (2) Comparison of density Experimental with HPHT VT PR EOS for binary mixtures of 40% n-Octane (1) + 60% n- Hexane (2)
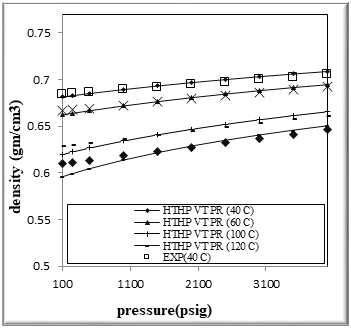
Figure (3) Comparison of density Experimental with HPHT VT PR EOS for binary mixtures of 60% n-Octane (1) + 40% n- Hexane (2)
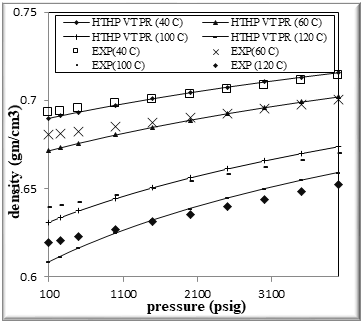
Figure (4) Comparison of density Experimental with HPHT VT PR EOS for binary mixtures of 80% n-Octane (1) + 20% n- Hexane (2)
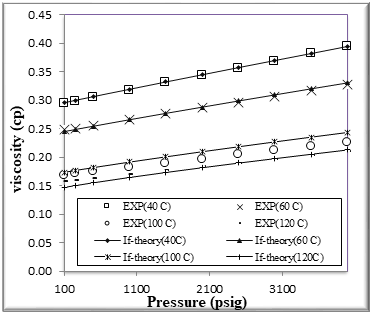
Figure (5) Comparison of viscosity Experimental with if theory for binary mixtures of 20% n-Octane (1) + 80% n- Hexane (2)
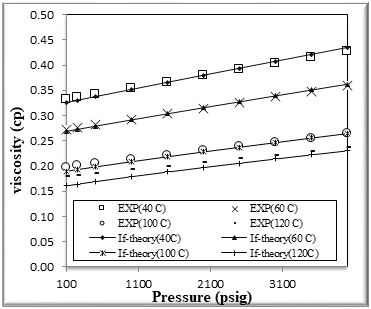
Figure (6) Comparison of viscosity Experimental with if theory for binary mixtures of 40% n-Octane (1) + 60% n- Hexane (2)
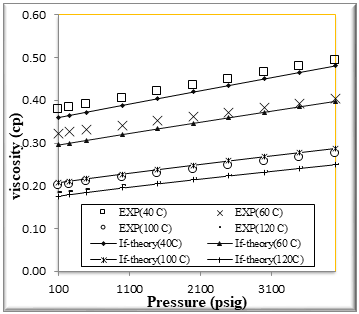
Figure (7) Comparison of viscosity Experimental with if theory for binary mixtures of 60% n-Octane (1) + 40% n- Hexane (2)
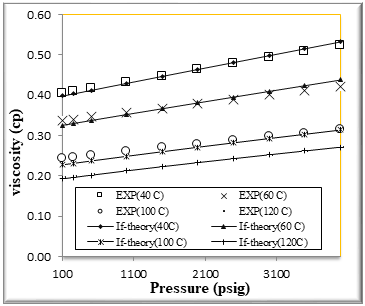
Figure (8) Comparison of viscosity Experimental with if theory for binary mixtures of 80% n-Octane (1) + 20% n- Hexane (2)
The accuracy of the predictions of equation of state is represented by the average absolute deviation in percent (AAD%) for the n data points.
The figures from (1) to (4) show the comparison results of density over wide range of temperature and pressure where the AAD show in table (10) this method yield very good predications.
If theory for viscosity modeling is used conjunction with PR EOS The general model if theory presented in this work are based on the viscosity behavior of binary mixtures n-hexane + n-octane. If theory provide good viscosity predictions of hydrocarbons. However, F-theory under -predicts the viscosity .
Table (10): AAD % of measurement results of binary mixtures with experimental values for densities and viscosities
| Binary mixtures | AAD% | |
| f- Theory | HTHP VT PR EOS | |
| 80% n- Hexane(1)+ 20% n-Octane(2) | 1.85745 | 0.82275 |
| 60% n- Hexane (1)+ 40% n-Octane (2) | 1.83341 | 0.61737 |
| 40% n- Hexane (1)+ 60% n-Octane (2) | 2.91209 | 0.56162 |
| 20% n- Hexane (1)+ 80% n-Octane (2) | 1.44235 | 0.56568 |
The estimation of recommended viscosities have been performed within the experimental temperature and pressure ranges. Because the viscosity modeling with the f-theory does not depend on the accuracy of the density, since the viscosity is linked to the pressure in the f-theory, the f-theory approach is a faster method in order to obtain recommended viscosities.
The uncertainty in the dilute gas viscosity predicted by Eq.(7) will not have any effect on the total predicted viscosity of subcritical liquids, since the total viscosity of a subcritical liquid is very high compared to the dilute gas viscosity contribution. However, when predicting the viscosity of light gases or dense fluids at high temperatures the estimated dilute gas viscosity term becomes important. This is due to the fact that the dilute gas viscosity increases with increasing temperature. while the viscosity of dense fluids decreases with increasing temperatures.
The very accurate viscosity predictions obtained over wide ranges of temperature and pressure for binary mixtures n-hexane + n-octane by the f-theory models can also clearly be seen in Figures from[5] to [8]
We had good results and AAD% for viscosity of binary mixtures n-hexane + n-octane shown in table [10]
Conclusions
Density and viscosity of binary mixtures n-hexane + n-octane was measured at temperatures from 40 °C up to 120 °C and pressure from 100 to 4000 psig. The measured density data are in good agreement with the literature data.
The high temperature high pressure volume translate PR EOS Model is applied to correlate molar volume to predicted density for binary mixtures n-hexane + n-octane The new proposed HTHP VT-PR equations of state provide very good results with an overall AAD table [10]
The Fraction theory-Model is applied to predicted viscosity binary mixtures n-hexane + n-octane and comparison with the experimental results of binary mixtures n-hexane + n-octane obtained in this work.
F-theory typically gives average absolute deviation in percent (AAD%) from
experimental viscosity values shown in table [10]
Nomenclature
MW molecular weight of component
p total pressure
pa van der Waals attractive pressure term
pc critical pressure
pr van der Waals repulsive pressure term
R molar gas constant
T absolute temperature
Tc critical temperature
vc critical volume
A parameter for the new proposed equations of state
B parameter for the new proposed equations of state
c volume correction
k0–k6 constants of the new proposed equations of state
Greek Letters
density ( g cm-3 )
dynamic viscosity ( cp )
total viscosity
c critical viscosity
f friction viscosity
0 dilute gas viscosity
κa linear attractive viscous friction coefficient
κr linear repulsive viscous friction coefficient
κrr quadratic repulsive viscous friction coefficient
c critical molar density
ω Pitzer’s a centric factor
Acknowledgeme
Superscripts
* characteristic value
~ reduced value
Subscripts
component
c critical
r reduced
exp experimental
ref reference
References
[1] Quiñones-Cisneros S.E., Zéberg-Mikkelsen C.K., and Stenby E.H.: The Friction Theory (f-theory) for Viscosity Modeling. Fluid Phase Equilibria. 169 (2000) 249 – 276.
[2] Claus K. Zéberg-Mikkelsen Ph.D. Thesis .VISCOSITY STUDY OF HYDROCARBON FLUIDS AT RESERVOIR CONDITIONS MODELING AND MEASUREMENTS*,Technical University of Denmark, Lyngby Denmark June 2001
[3] Quiñones-Cisneros S.E., Zéberg-Mikkelsen C.K., and Stenby E.H.: One Parameter Friction Theory Models for Viscosity. Fluid Phase Equilibria. 178 (2001a) 1 – 16.
[4] Redlich O. and Kwong J.N.S.: On the Thermodynamic of Solutions. V An Equation of State. Fugacities of Gaseous Solutions. Chemical Review. 44 (1949) 233 – 244.
[5] Soave G.: Equilibrium Constants from a Modified Redlich-Kwong Equation of State . Chemical Engineering Science. 27 (1972) 1197 – 1203.
[6] Peng D.-Y. and Robinson D.B.:A New Two-Constant Equation of State. Industrial & Engineering Chemistry Fundamentals. 15(1976) 59 – 64.
[7] Mathias P.M.: A Versatile Phase Equilibrium Equation of State . Industrial Engineering Chemistry Process Design and Development.22(1983) 385 – 391
[8] Stryjek R. and Vera J.H.: PRSV: An Improved Peng-Robinson Equation of State for Pure Compounds and Mixtures. The Canadian Journal of Chemical Engineering. 64 (1986) 323 – 333.
[9] Boston J.F. and Mathias P.M.: Phase Equilibria in a Third-Generation Process Simulator . 2nd International Conference on Phase Equilibria and Fluid Properties in the Chemical Process Industries. Berlin (West). 17 – 21 March (1980).
[10] Peneloux A., Rauzy E., Freze R.:A Consistent Correction for Redlich-Kwong-Soave Volumes. Fluid Phase Equilibria. 8 (1982) 7 – 23
[11] Zéberg-Mikkelsen C.K., Quiñones-Cisneros S.E., and Stenby E.H.: Viscosity Prediction of Hydrocarbon Mixtures Based on the Friction Theory. Petroleum Science and Technology. 19 (2001) 899 – 909.
[12] -Zéberg-Mikkelsen C.K., Quiñones-Cisneros S.E., and Stenby E.H.: Viscosity Prediction of Hydrocarbon Mixtures Based on the Friction Theory. Petroleum Science and Technology. 19 (2001) 899 – 909.
[13] Instruction Manual DMA HPM Density measuring cell for high pressure and high temperatures(Anton Paar GmbH. Anton -Paar –Str.20A-8054Graz/Austria –Europe)
[14] E. Kiran 1 and Y. L. Sen 1 .High-Pressure Viscosity and Density of n-Alkanes. International Journal of Thermophysics, Vol. 13, No. 3, 1992
[15] Hseen Baled a,b,∗, Robert M. Enick a,b, Yue Wu a,c, Mark A. McHugh a,c
, Ward Burgess a,Deepak Tapriyal a,d
, Bryan D. Morreale a
Prediction of hydrocarbon densities at extreme conditions using volume-translated SRK and PR equations of state fit to high temperature, high pressure PVT data
Fluid Phase Equilibria 317 (2012) 65– 76